Finding slow code with Instruments
Published on: December 8, 2019Every once in a while we run into performance problems. One thing you can do when this happens is to measure how long certain things in your code take. You can do this using signposts. However, there are times when we need deeper insights in our code. More specifically, sometimes you simply want to know exactly how long each function in your code takes to execute. You can gain these insights using the Time Profiler Instrument. In today's article, I will show you how you can use the Time Profiler to analyze your code, and how you can optimize its output so you can gain valuable insights.
Exploring the Time Profiler Instrument
If you want to analyze your app, you need to run it for profiling. You can do this by pressing cmd+i or by using the Product -> Profile menu item. When your app is done compiling, it will be installed on your device and Instruments will launch. In the window that appears when Instruments launches, pick the Time Profiler template:
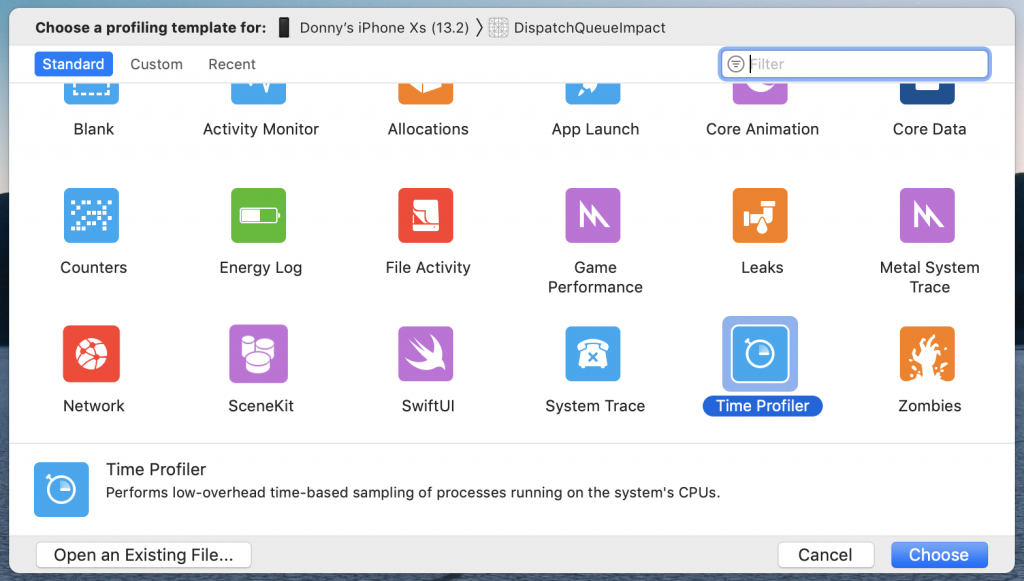
When you select this template, Instruments will launch a new Instruments session with several tracks.
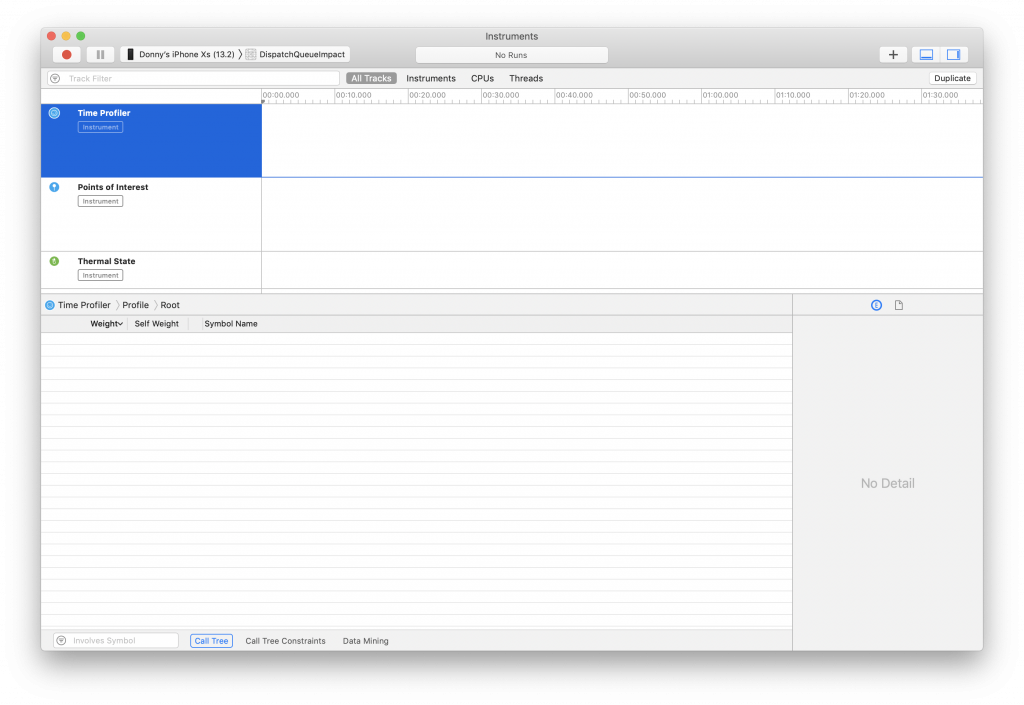
The one you're most interested in is the Time Profiler track. When you select the Time Profiler track, the table under the Instruments timeline will show your app's objects and their methods, and how much time is spent in each method. To profile your app, unlock your device and hit the record button in the top left corner. Use your app like you normally would and make sure to spend some time with the feature your most interested in. Instruments will begin filling up with measurements from your code as shown in the following screenshot.
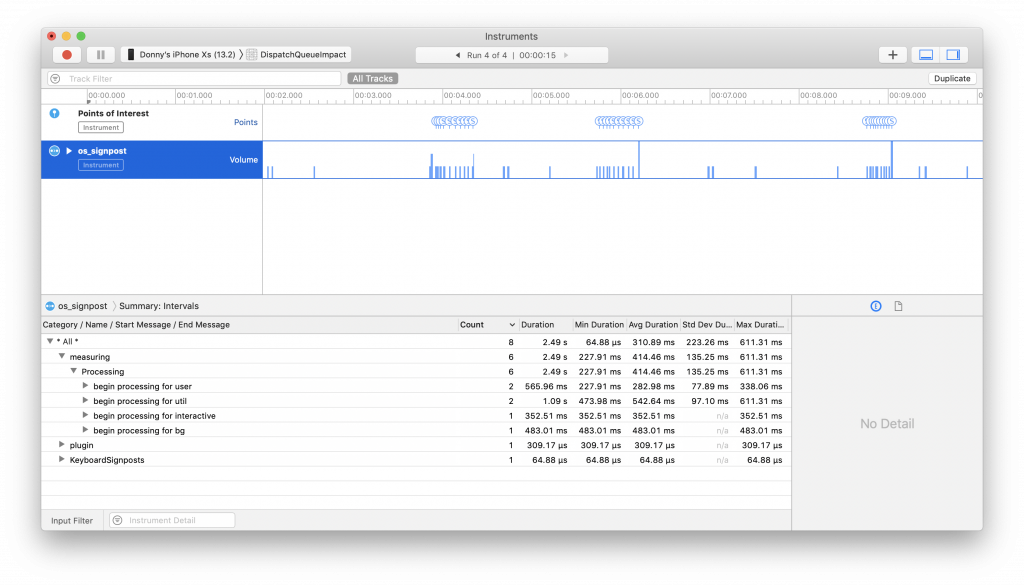
The Time Profiler takes snapshots of your app's memory and CPU usage every couple of milliseconds to create a picture of what is running, and when. Based on this, the Time Profiler measures how much time is spent in each method. The flip side here is that the Time Profiler is not suited for fine-grained, high-resolution profiling of your code. If this is what you need, you should use signposts instead.
Note
It's always best to run your app on a real device if you want to run the Time Profiler on it. The simulator has all the processing power from your working machine at its disposal so measurements will be very skewed if you profile your app using the Simulator.
Once you feel like you've captured enough data to work with, you can begin analyzing your measurements.
Analyzing the Time Profiler's measurements
By default, Instruments will show its measurements from the inside out. The topmost item in the tree is your app, followed by several threads. Note how instruments displays a number of seconds spent in each thread. This counter only increments if your app is actively processing data on the corresponding thread. Since you're probably not really interested in working your way from the inside out, and also not in system libraries, it's a good idea to change the way instruments visualizes data. In the bottom of the window, there's a button named Call Tree, if you click that, you can specify how Instruments should display its measurements. I always use the following settings:
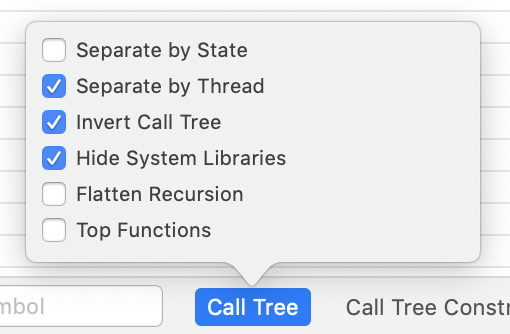
At the surface, not much will seem to have changed. Your code is still separated by thread, but if you expand the threads, your code is listed first because the call tree is now shown from the outside in rather than from the inside out. Every time you drill down one level deeper, Instruments shows what method called the method you're drilling into.
In the app I've been profiling here I was looking for reasons that it took a long time to update my UI after an image has finished downloading. I can see that a lot of time is spent in my performTask method. This is the method that's responsible for fetching and processing the image, and ultimately pass it to the UI. There's also some time spent in the UIImage initializer. Which is called from the performTask method as shown in the following screenshot:

Based on these findings, you would conclude that something fishy might be happening in performTask because we're spending all of our time there. If the UIImage initialization was slow, we would be spending way more time in that initializer. And since the code spends so much time in performTask, but not in the UIImage initializer, this is a good first guess.
In this case, I made performTask slow on purpose. After loading an image I would write it to the phone's documents directory a couple of times, and also convert it to a UIImage not once, but five times before updating the UI. In this case, a potential fix would be to either update the UI immediately before persisting the image to the documents directory and to remove the loop that's obviously not needed.
In summary
From personal experience, I can tell you that the Time Profiler Instrument is an extremely valuable tool in an iOS developer's toolbox. If your UI doesn't scroll as smooth as you want, or if your device runs hot every time you use your app, or if see CPU and memory usage in Xcode rise all the time, the Time Profiler is extremely helpful to gain an understanding of what your code is doing exactly. When you profile your code and know what's going on, you can start researching performance problems in your code with more confidence.
If you have any questions about the Time Profiler, have feedback or just want to reach out, you can find me on Twitter.

)
