Modern logging with the OSLog framework in Swift
Published on: June 7, 2024We all know that print is the most ubiquitous and useful debugging tool in a developer’s toolbox. Sure, we have breakpoints too but what’s the fun in that? Sprinkling some prints throughout our codebase to debug a problem is way more fun! And of course when we print more than we can handle we just add some useful prefixes to our messages and we’re good to go again.
What if i told that you can do way better with just a few lines of code. You can send your prints to more places, give them a priority, and more. Of course, we don’t call it printing anymore; we call it logging.
Logging is a key method to collecting important data for your app. From simple debugging strings to recording entire chains of events, having a good logging strategy can help you debug problems while you’re writing your app in Xcode and also once you’ve shipped your app to the store.
In this post, I’d like to show you how you can set up a Logger from the OSLog framework in your app, and how you can use it to log messages that can help you debug your app and gain insights about problems your users experience.
Setting up a Logger object
To set up a logger object all you need to do is import OSLog and create an instance of the Logger object:
import OSLog

let logger = Logger()

struct MyApp: App {
  // ...
}
This approach creates a global logger object that you can use from anywhere within your app. Since I didn’t pass any custom configuration, the logger will just log messages using the default parameters.
That said, it’s wise to actually provide two pieces of configuration for your logger:
- A subsystem
- A category
By providing these two parameters, you can make filtering log messages a lot easier, and it allows you to group messages from multiple loggers together.
For example, I like to create a data model debugger that I can use to log data model related information. Here’s how I can create such a logger:
let modelLogger = Logger.init(
    subsystem: "com.myapp.models",
    category: "myapp.debugging"
)
Apple recommends that we name our subsystems using reverse-DNS notation. So for example, com.myapp.models for a subsystem that encompasses models within my app. You could create loggers for every module in your app and give each module its own subsystem for example. That way, you can easily figure out which module generated which log messages.
The second argument provided to my logger is a category. I can use this category to group related messaged together, even when they originated from different subsystems. Apple doesn’t provide any naming conventions for category so you can do whatever you want here.
It’s perfectly acceptable for a single app to have multiple loggers. You can create multiple loggers for a single subsystem for example so that you can provide different categories. Having narrowly scoped loggers in your apps with well-named categories and subsystems will greatly improve your debugging experience as we’ll see later on.
Once you’ve created an instance of your logger and found a nice place to hold on to it (I usually like to have it available as a global constant but you might want to inject it or wrap it in a class of your own) you can start sending your first log messages. Let’s see how that works.
Logging your first messages
When you log messages through your logger instance, these messages will end up in different places depending on which kind of log level you’re using. We’ll discuss log levels later so for now we’ll just use the simple log method to log our messages.
Let’s log a simple “Hello, world!” message in response to a button tap in SwiftUI:
Button("Hello, world") {
  modelLogger.log("Hello, world!")
}
Calling log on your Logging instance will cause a message to be printed in your Xcode console, just like it would with print…
However, because we’re using a Logger, we can get Xcode to show us more information.
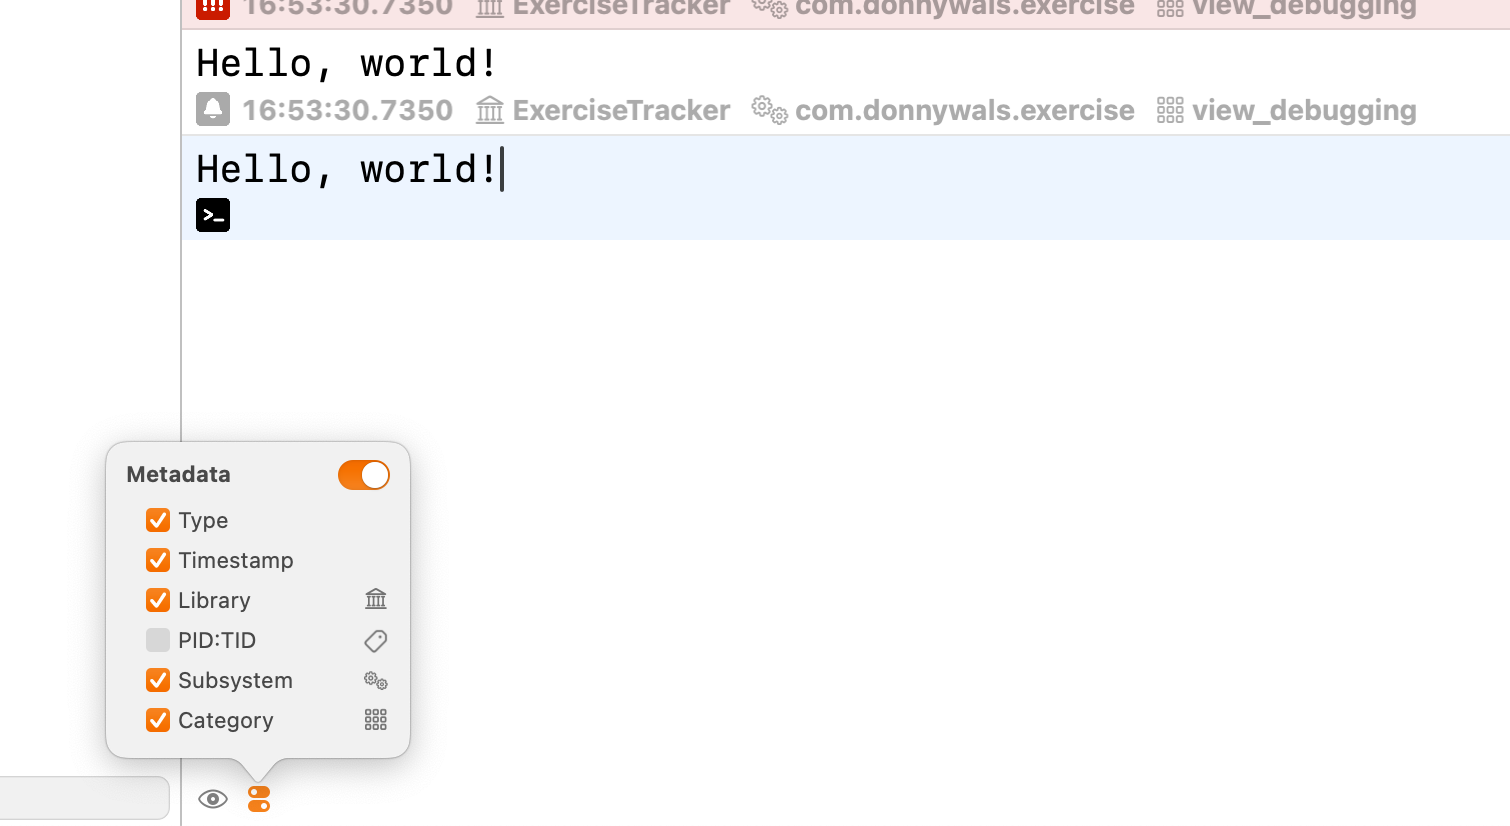
Here’s an example of the kinds of information you can view in your console.

Personally, I find the timestamp to be the most interesting aspect of this. Normally your print statements won’t show them and it can be hard to distinguish between things that happened a second or two apart and things that happen concurrently or in very rapid succession.
For comparison, here’s what the same string looks like when we print it using print

There’s no extra information so we have no clue of when exactly this statement was printed, by which subsystem, and what kind of debugging we were trying to do.
Xcode won’t show you all the information above by default though. You need to enable it through the metadata menu in the console area. The nice thing is, you don’t need to have done this before you started debugging so you can enable that whenever you’d like.
Gaining so much insight into the information we’re logging is super valuable and can really make debugging so much easier. Especially with logging categories and subsystems it’ll be much easier to retrace where a log message came from without resorting to adding prefixes or emoji to your log messages.
If you want to filter all your log messages by subsystem or category, you can actually just search for your log message using the console’s search area.
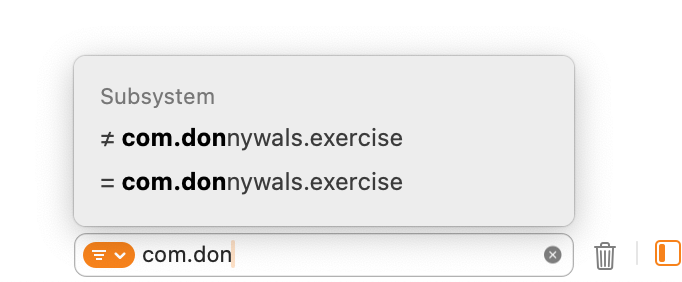
Notice how Xcode detects that I’m searching for a string that matches a known subsystem and it offers to either include or exclude subsystems matching a given string.
This allows you to easily drown out all your logging noise and see exactly what you’re interested in. You can have as many subsystems, categories, and loggers as you’d like in your app so I highly recommend to create loggers that are used for specific purposes and modules if you can. It’ll make debugging so much easier.
Accessing logs outside of Xcode
There are multiple ways for you to gain access to log messages even when Xcode isn’t running. My personal favorite is to use Console app.
Finding logs in the Console app
Through the Console app on your mac you can connect to your phone and see a live feed of all log messages that are being sent to the console. That includes messages that you’re sending from your own apps, as you can see here:
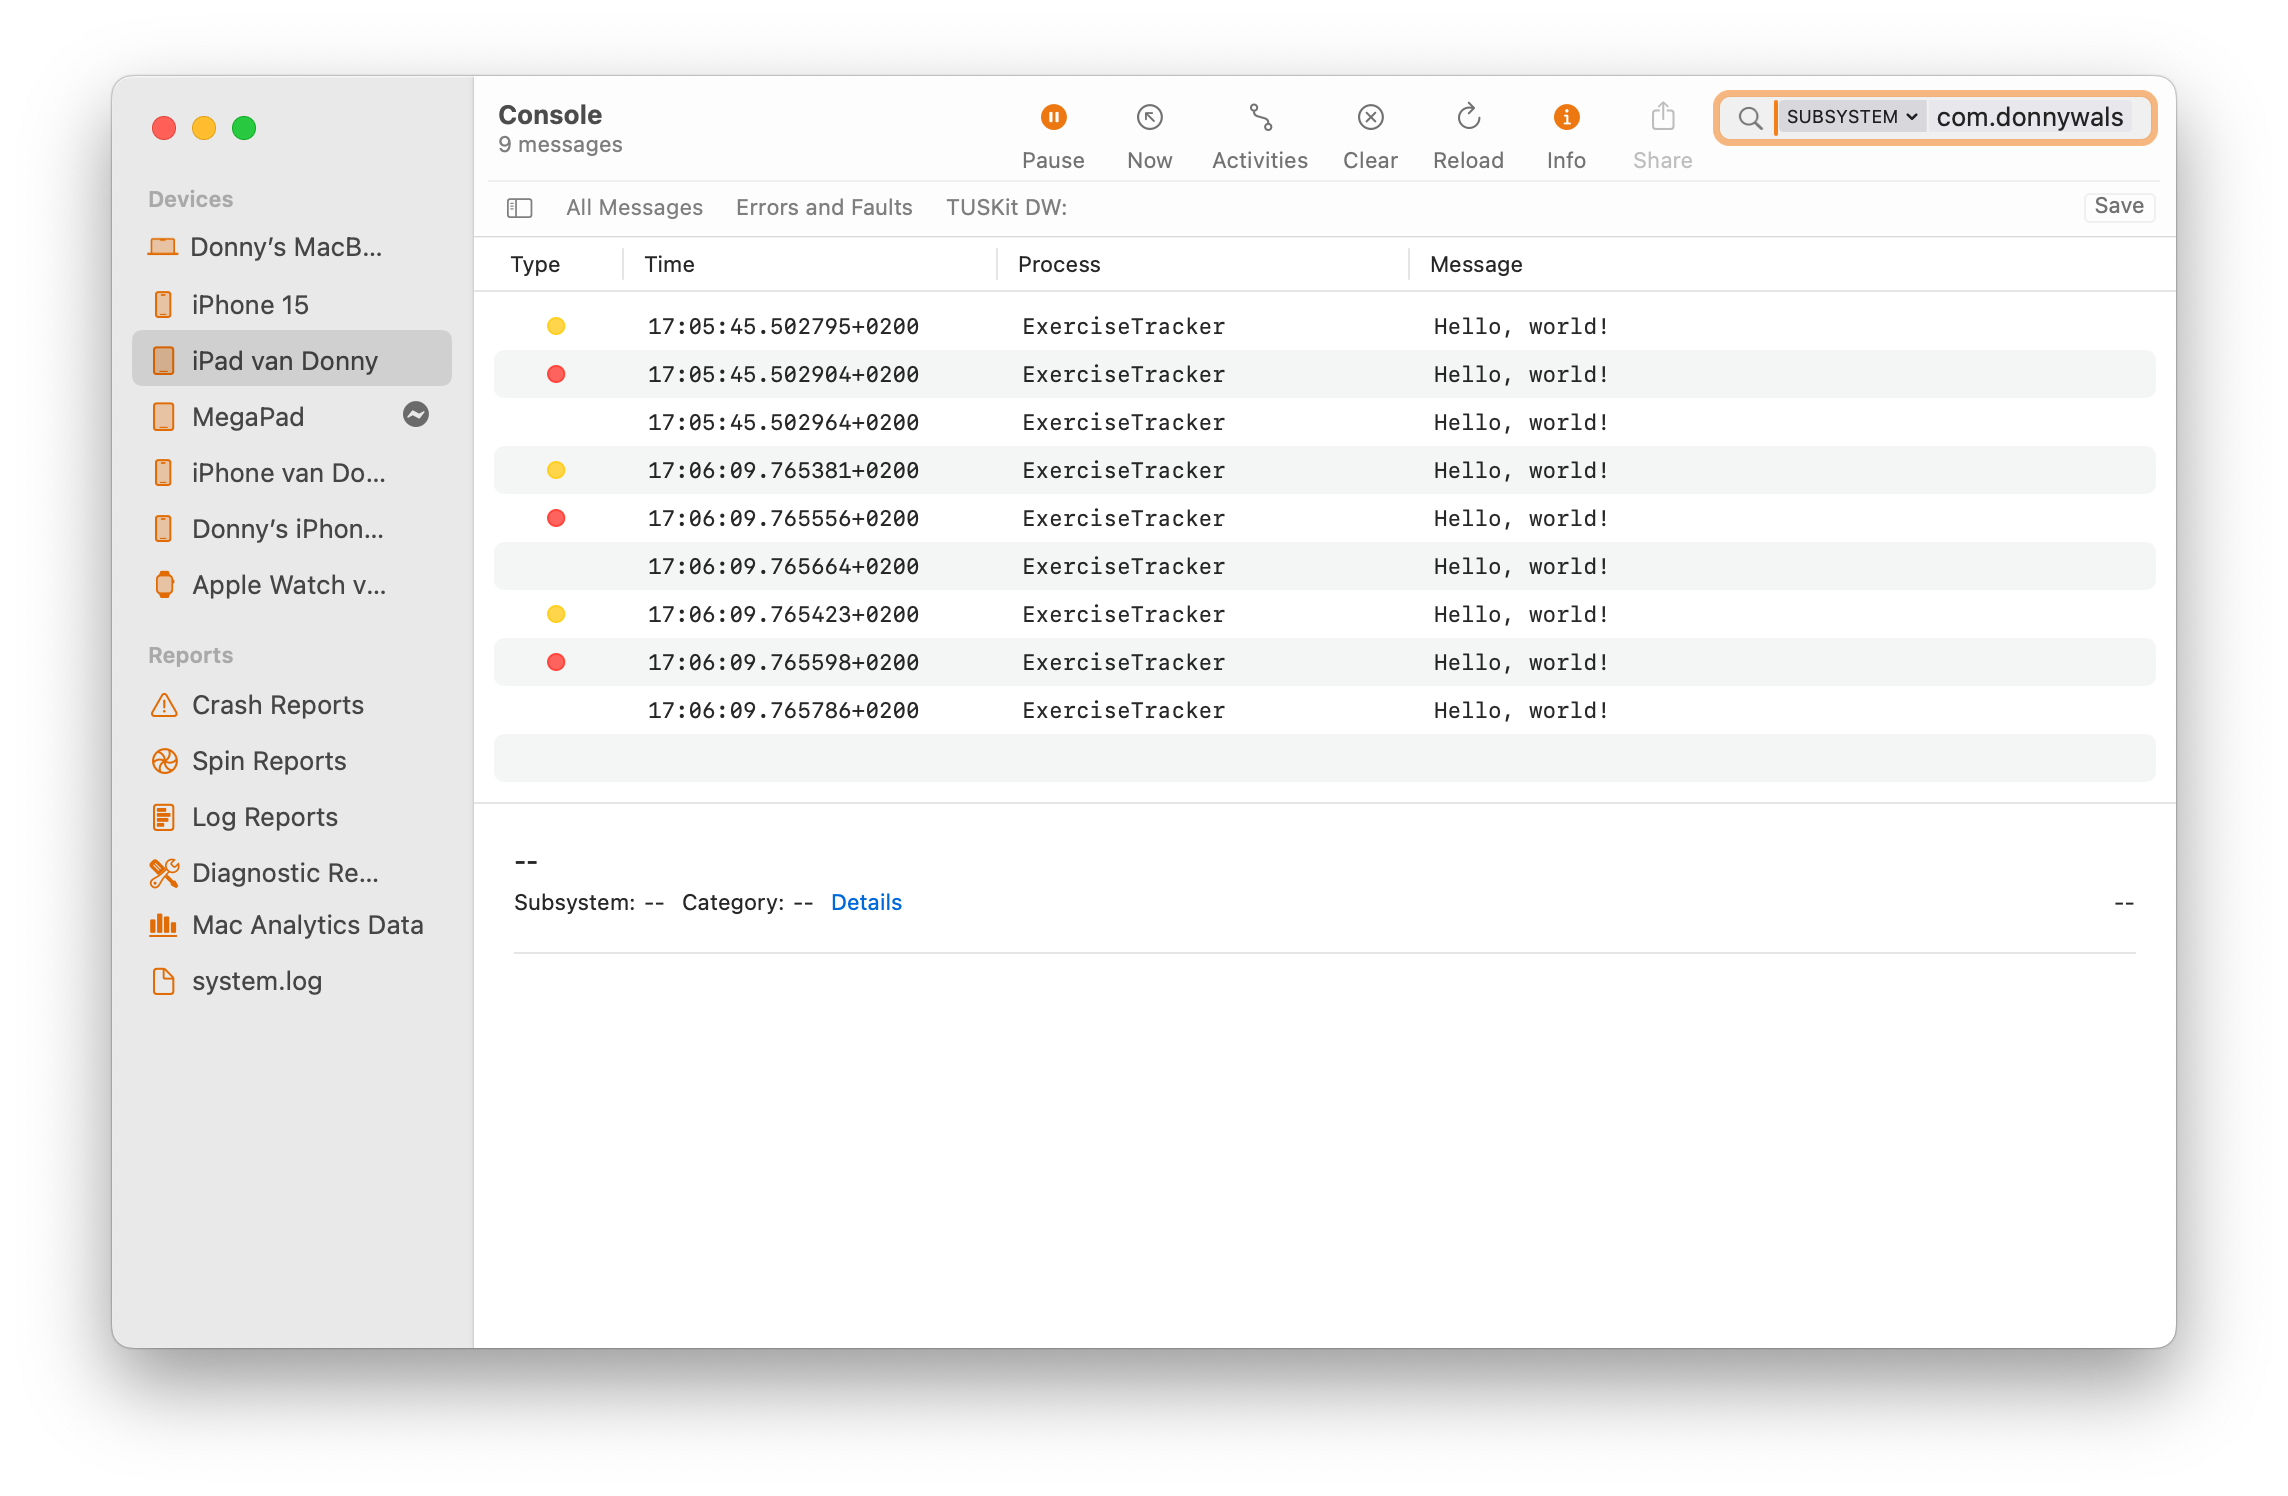
The console provides plenty of filtering options to make sure you only see logs that are interesting to you. I’ve found the Console app logging to be invaluable while testing stuff that involves background up- and downloads where I would close my app, force it out of memory (and detach the debugger) so I could see whether all delegate methods are called at the right times with the expected values.
It’s also quite useful to be able to plug in a phone to your Mac, open Console, and browse your app’s logs. Within an office this has allowed me to do some rough debugging on other people’s devices without having to build directly to these devices from Xcode. Very fast, very useful.
Accessing logs in your app
If you know that you’d like to be able to receive logs from users so that you can debug issues with full access to your log messages, you can implement a log viewer in your app. To retrieve logs from the OSLog store, you can use the OSLogStore class to fetch your log messages.
For example, here’s what a simple view looks like that fetches all log messages that belong to subsystems that I’ve created for my app:
import Foundation
import OSLog
import SwiftUI

struct LogsViewer: View {
    let logs: [OSLogEntryLog]

    init() {
        let logStore = try! OSLogStore(scope: .currentProcessIdentifier)
        self.logs = try! logStore.getEntries().compactMap { entry in
            guard let logEntry = entry as? OSLogEntryLog,
                  logEntry.subsystem.starts(with: "com.donnywals") == true else {
                return nil
            }

            return logEntry
        }
    }

    var body: some View {
        List(logs, id: \.self) { log in
            VStack(alignment: .leading) {
                Text(log.composedMessage)
                HStack {
                    Text(log.subsystem)
                    Text(log.date, format: .dateTime)
                }.bold()
            }
        }
    }
}
It’s a pretty simple view but it does help me to obtain stored log messages rather easily. Adding a view like this to your app and expanding it with an option to export a JSON file that contains all your logs (based on your own Codable models) can make obtaining logs from your users a breeze.
Logging and privacy
Sometimes, you might want to log information that could be considered privacy sensitive in order to make debugging easier. This information might not be required for you to actually debug and profile your app. It’s a good idea to redact non-required personal information that you’re collecting when it’s being logged on user’s devices.
By default, when you insert variables into your strings these variables will be considered as data that should be redacted. Here’s an example:
appLogger.log(level: .default, "Hello, world! \(accessToken)")I’m logging an access token in this log message. When I profile my app with the debugger attached, everything I log will be printed as you would expect; I can see the access token.
However, when you disconnect the debugger, launch your app, and then view your logs in the Console app while you’re not running your app through Xcode, the log messages will look more like this:
Hello, world! <private>The variable that you’ve added to your log is redacted to protect your user’s privacy. If you consider the information you’re inserting to be non-privacy sensitive information, you can mark the variable as public as follows:
appLogger.log(level: .default, "Background status: \(newStatus, privacy: .public)")In this case I want to be able to see the status of my background action handler so I need to mark this information as public.
Note that whether or not your log messages are recorded when the debugger isn’t attached depends on the log level you’re using. The default log level gets persisted and is available in Console app when you’re not debugging. However, the debug and info log levels are only shown when the debugger is attached.
Other log levels that are useful when you want to make sure you can see them even if the debugger isn’t attached are error and fault.
If you want to be able to track whether privacy sensitive information remains the same throughout your app, you can ask the logger to create a hash for the privacy sensitive value. This allows you to ensure data consistency without actually knowing the content of what’s being logged.
You can do this as follows:
appLogger.log(level: .default, "Hello, world! \(accessToken, privacy: .private(mask: .hash))")This helps you to debug data consistency issues without sacrificing your user’s privacy which is really nice.
In Summary
Being able to debug and profile your apps is essential to your app’s success. Logging is an invaluable tool that you can use while developing your app to replace your standard print calls and it scales beautifully to production situations where you need to be able to obtain collected logs from your user’s devices.
I highly recommend that you start experimenting with Logging today by replacing your print statements with debug level logging so that you’ll be able to apply better filtering and searching as well as stream logs in your macOS console.
Don’t forget that you can make multiple Logger objects for different parts of your app. Being able to filter by subsystem and category is extremely useful and makes debugging and tracing your logs so much easier.