Profiling and debugging your Combine code with Timelane
Published on: March 16, 2020When we write code, we write bugs. It's one of the laws of the universe that we can't seem to escape. The tools we have to discover, analyze and fix these bugs are extremely important because without good debugging tools we'd be poking at a black box until we kind of figure out what might be happening in our code. Debugging synchronous code is hard enough already, but once your code involves several streams of asynchronous work debugging becomes much harder because asynchronous code can be inherently hard to keep track of.
Combine code is asynchronous by nature. When you use Combine to receive or send values, you're dealing with an asynchronous stream of values that will (or will not) output information over time. One way to gain insight into what your Combine code is doing is to use Combine's print operator which will print information to Xcode's console. While this is fine if you're debugging one stream at a time, the console can become unwieldy quickly when you're logging information on multiple subscriptions or if you're logging lots of information that's not necessarily related to Combine.
In this week's blog post I'd like to take a closer look at Marin Todorov's super helpful Timeline instrument that helps you gain insight into Combine code by visualizing what your Combine code is doing in realtime. By the end of this post, you will know how to install, configure and use Timelane in your projects.
Preparing to use Timelane
To use Timelane, there are two things you need to do. First, you need to install the Instruments template that is used to visualize your data streams. Second, you need to add the TimelaneCore and TimelaneCombine dependencies to your project. Note that there is also a RxTimelane framework available that allows you to use Timelane to profile RxSwift code. In this post, I will focus on Combine but the RxSwift version works in the same manner as the Combine version.
To install the Timelane Instruments template, go to the Timelane releases page on Github and download the Timelane app zip file. Open the downloaded application and follow the installation instructions shown in the app:
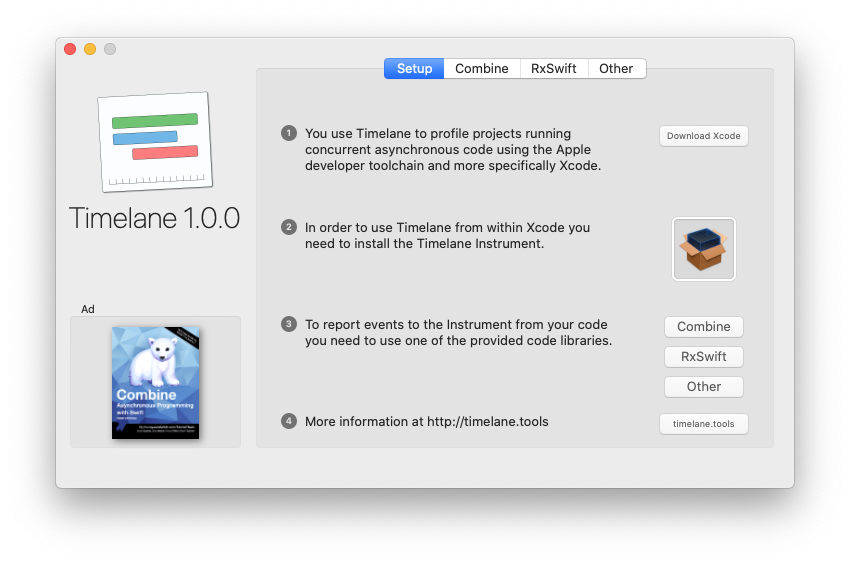
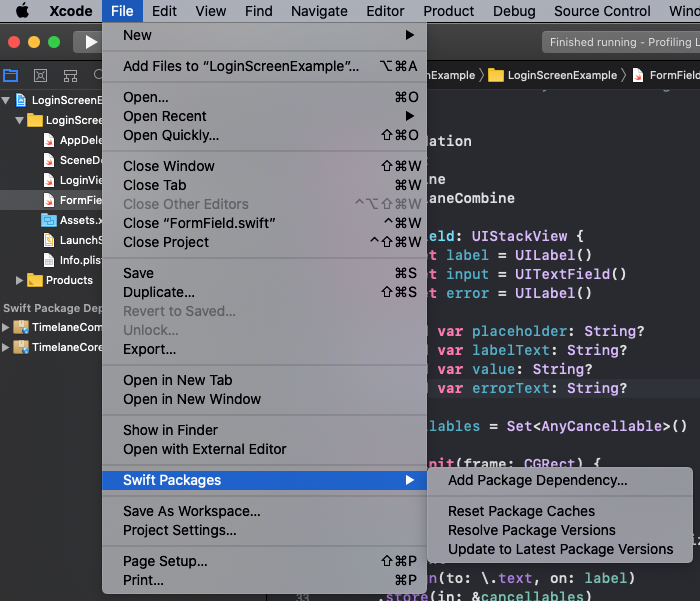
After installing the Instruments template, you can go ahead and open Xcode. The easiest way to integrate Timelane is through the Swift Package Manager. Open the project you want to use Timelane in and navigate to File -> Swift Packages -> Add Package Dependency.
In the pop-up that appears, enter the TimelaneCombine Github URL which is: https://github.com/icanzilb/TimelaneCombine.
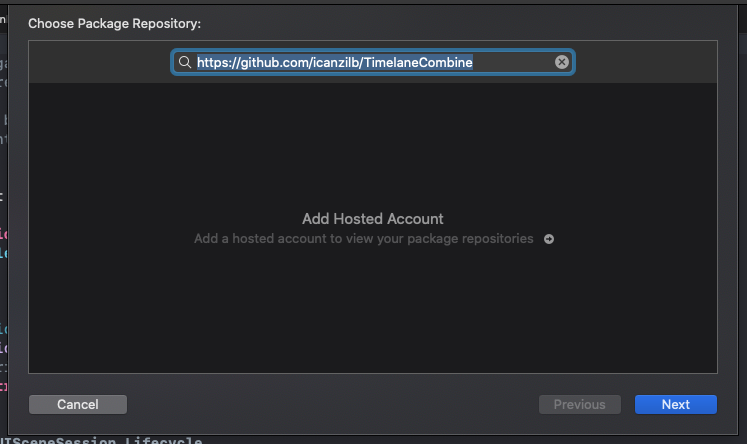
Adding this package to your project will automatically pull down and install the TimelaneCombine and TimelaneCore packages in your project. If you're using Cocoapods or Carthage to manage your dependencies you can add the TimelaneCombine dependency to your Podfile or Cartfile as needed.
Debugging subscriptions with Timelane
Once you have all the required dependencies in place, you can begin profiling your Combine code quite easily. All you need to do is add a call to Timelane's lane operator after the publisher you want to debug and you're good to go. For example, if you have a publisher in your project that downloads data from the web and decodes it into a JSON model, you might use the following code to set up Timelane to make sure your code works as expected:
URLSession.shared.dataTaskPublisher(for: URL(string: "https://donnywals.com")!)
  .map(\.data)
  .decode(type: SomeModel.self, decoder: JSONDecoder())
  .lane("Decoding data")
  .sink(receiveCompletion: { _ in }, receiveValue: { value in
    print(value)
  })
  .store(in: &cancellables)
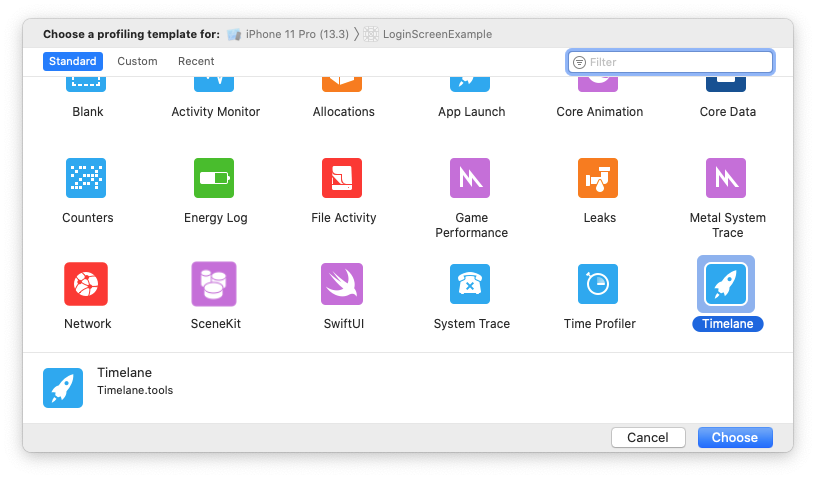
Note that most code can be written just like you would write it normally. All you need to do to profile your code is add a call to the lane operator and provide a name for the lane you want to visualize the publisher stream in. To debug this code, you need to run your app with Instruments enabled. To do this go to Product -> Profile or press cmd + i. When your project is compiled, Instruments will ask you to choose a template for your profiling session. Make sure you choose the Timelane template:
Instruments will open the template and you can start your profiling session by pressing the record button in the top left corner of the window. You will see that Timelane will immediately visualize your publishers in realtime. The output for the code above looks as follows:
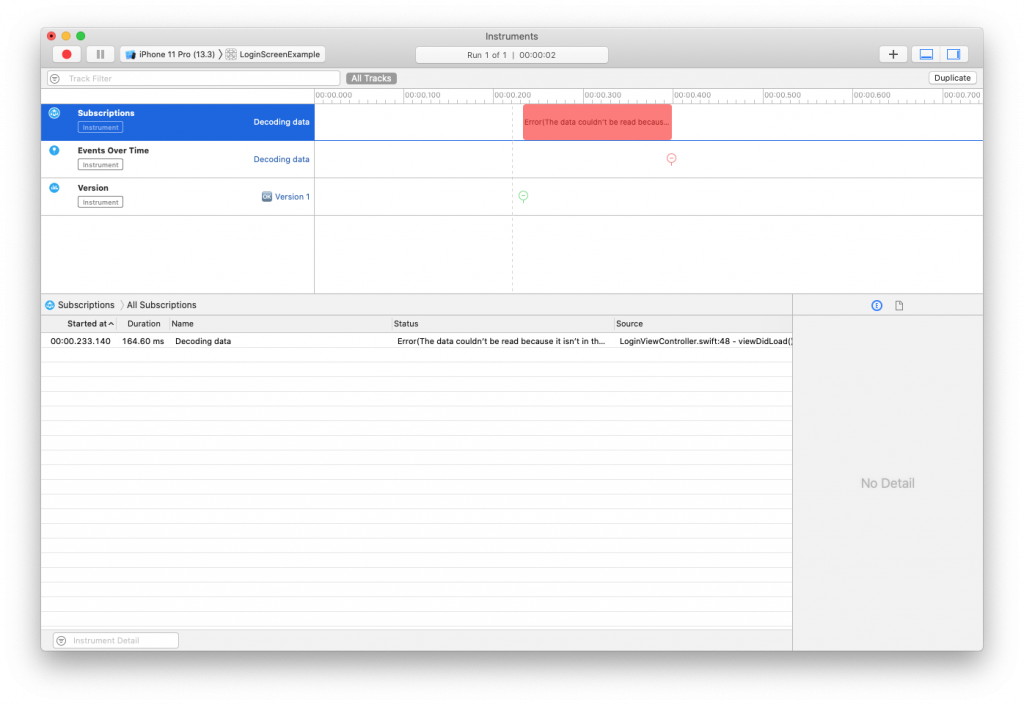
You can see that the stream failed because the subscription finished with an error. You can even see why. The loaded data wasn't in the correct format. This makes sense because I loaded the homepage of this website, which is HTML and I tried to decode it as JSON.
It's possible to visualize multiple steps of a single chain of publishers to see where exactly things go wrong. For example, you can add the lane operators to every step of the chain I showed earlier:
URLSession.shared.dataTaskPublisher(for: URL(string: "https://donnywals.com")!)
  .lane("Fetching data")
  .map(\.data)
  .lane("Mapping response")
  .decode(type: SomeModel.self, decoder: JSONDecoder())
  .lane("Decoding data")
  .sink(receiveCompletion: { _ in }, receiveValue: { value in
    print(value)
  })
  .store(in: &cancellables)
If you'd run Instruments with this code, you would see the following output:
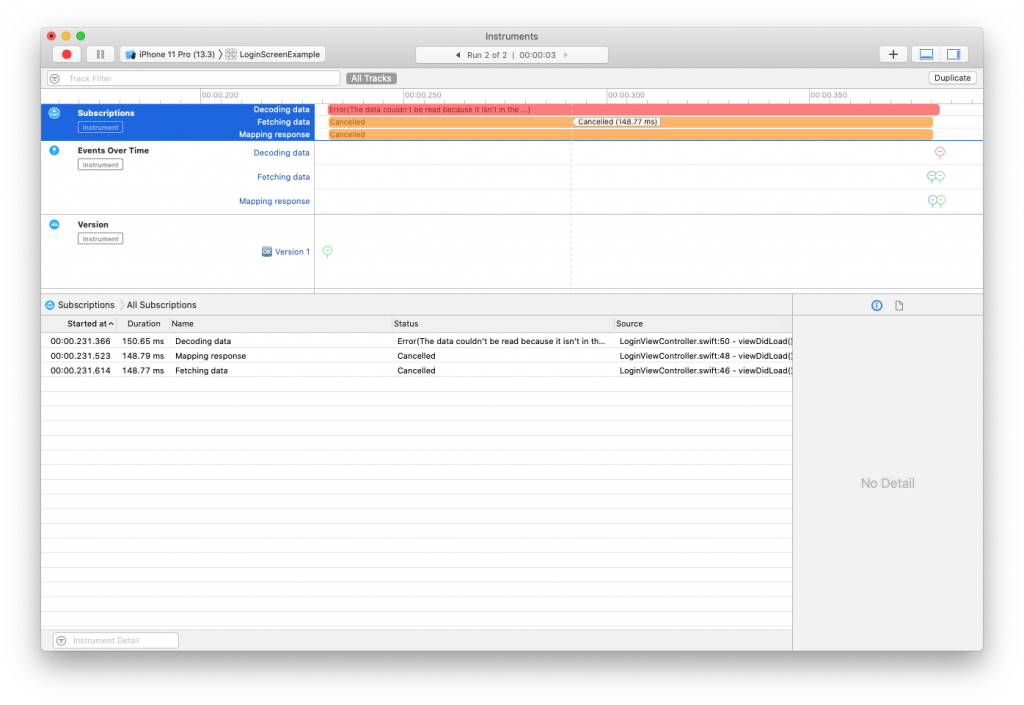
There are now multiple subscription lanes active and you can see that there are values for each subscription lane. Note that the two lanes we just added get canceled because decode fails. This is a detail in Combine that I would not have known about without profiling my code using Timeline. It might be an insignificant detail in the grand scheme of things but it's pretty neat either way.
In this case, you might not be interested in seeing a subscription lane for each lane operator you use. After all, all three lanes I created in the code I just showed you are tightly related to each other. And if any publisher in the chain throws an error, this error will travel through all downstream operators before it reaches the sink. This allows you to see exactly which publisher in the chain threw an error, but it also creates some visual noise that you may or may not be interested in. Here's an example of what happens when I replace the map from the example code with a tryMap and throw an error:
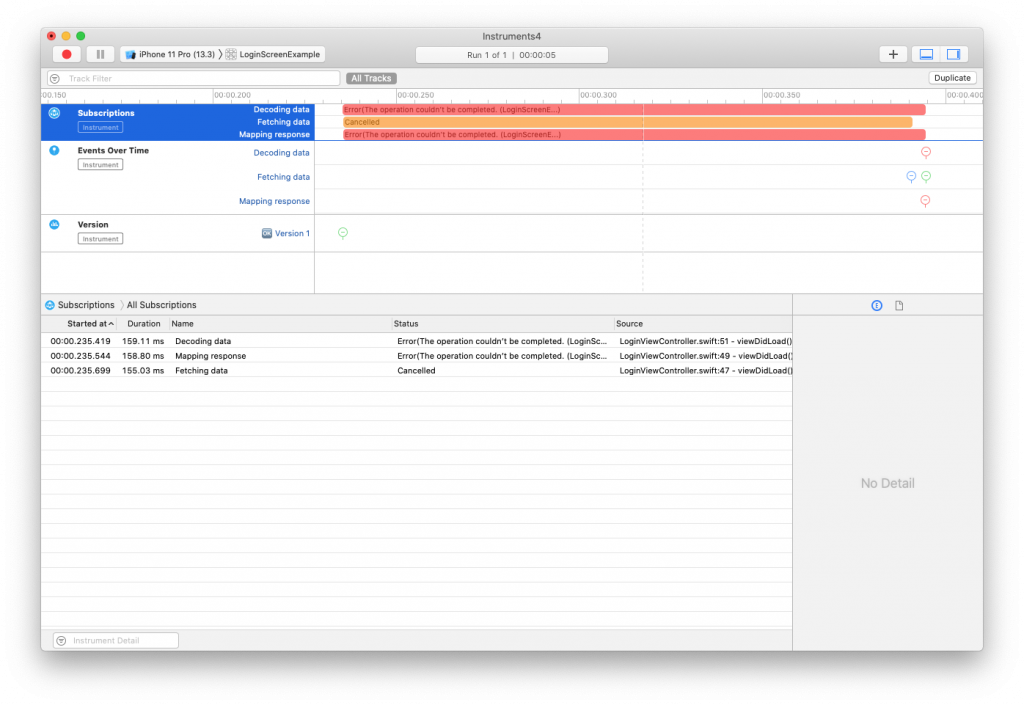
Timelane allows you to choose the lanes that it logs to. So in this case, it would make sense to only log subscription information for the last lane operator in the chain which is Decoding data. To do this, you can use the filter argument for lane:
URLSession.shared.dataTaskPublisher(for: URL(string: "https://donnywals.com")!)
  .lane("Fetching data", filter: [.event])
  .map(\.data)
  .lane("Mapping response", filter: [.event])
  .decode(type: SomeModel.self, decoder: JSONDecoder())
  .lane("Decoding data")
  .sink(receiveCompletion: { _ in }, receiveValue: { value in
    print(value)
  })
  .store(in: &cancellables)
By passing filter: [.event] to lane, you will only see events, or values, in Instruments and the subscription lane will online show the last lane from the code because that lane isn't filtered. By doing this you can limit the number of timelines that are shown in the subscription lane while still seeing all values that pass through your publisher chain.
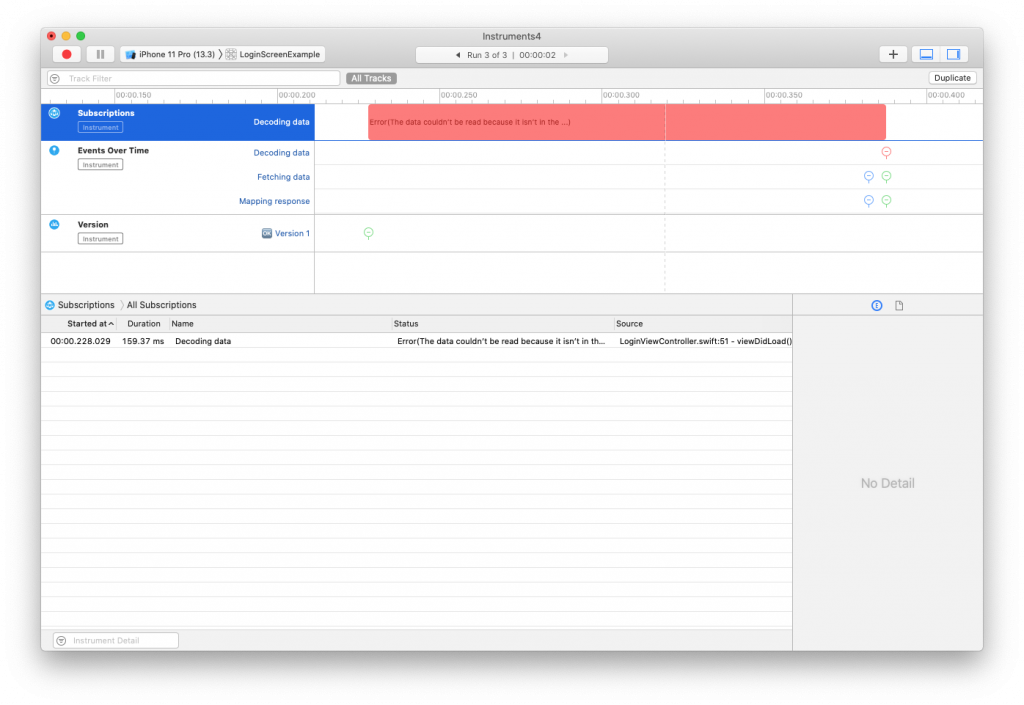
Visualizing events only is especially useful for publishers that never complete (or fail) like NotificationCenter.Publisher or maybe a CurrentValueSubject that you're using to send an infinite stream of custom values through your application.
If you're using @Published properties in your app and you want to easily track them in Timeline, you can use the @PublishedOnLane property wrapper where you would normally use @Published. The @PublishedOnLane property wrapper uses an @Published property wrapper internally and overrides projectedValue to return a publisher that has a lane operator applied to it. In other words, you get all the behavior you'd expect from an @Published property with the logging superpowers from Timelane. Here's what it looks like when you use @PublishedOnLane in your code:
@PublishedOnLane("A property") var aProperty: String = "Default value"
If you want to use this property wrapper without having its subscriptions show up in the subscriptions lane, you can apply a filter as follows:
@PublishedOnLane("A property", filter: [.event]) var aProperty: String = "Default value"
The result of applying this filter is exactly the same as it is when you use the lane operator.
Caution:
The filter option for @PublishedOnLane was merged the day before I published this post so there's a chance that it's not yet available by the time you get to experiment with this post. Keep an eye on Timeline updates and make sure to try it again once a new version is released.
Examining values in Timelane
So far, I have mostly focussed on showing you how Timelane visualizes a publisher's lifecycle. Going from created to being canceled, erroring and completing. I haven't shown you that Timelane also provides insight into a publisher's output. Consider a publisher that updates every time a user types a character. This publisher is debounced to make sure we don't process values while the user is still typing:
usernameField.$value
  .lane("Username pre-debounce", filter: [.event])
  .debounce(for: 0.3, scheduler: DispatchQueue.main)
  .lane("Username", filter: [.event])
  .sink(receiveValue: { value in
    // handle value
  })
  .store(in: &cancellables)
By applying a lane before, and after the debounce it's possible to see exactly what I've typed, and what was sent to the sink. Examine the following screenshot:
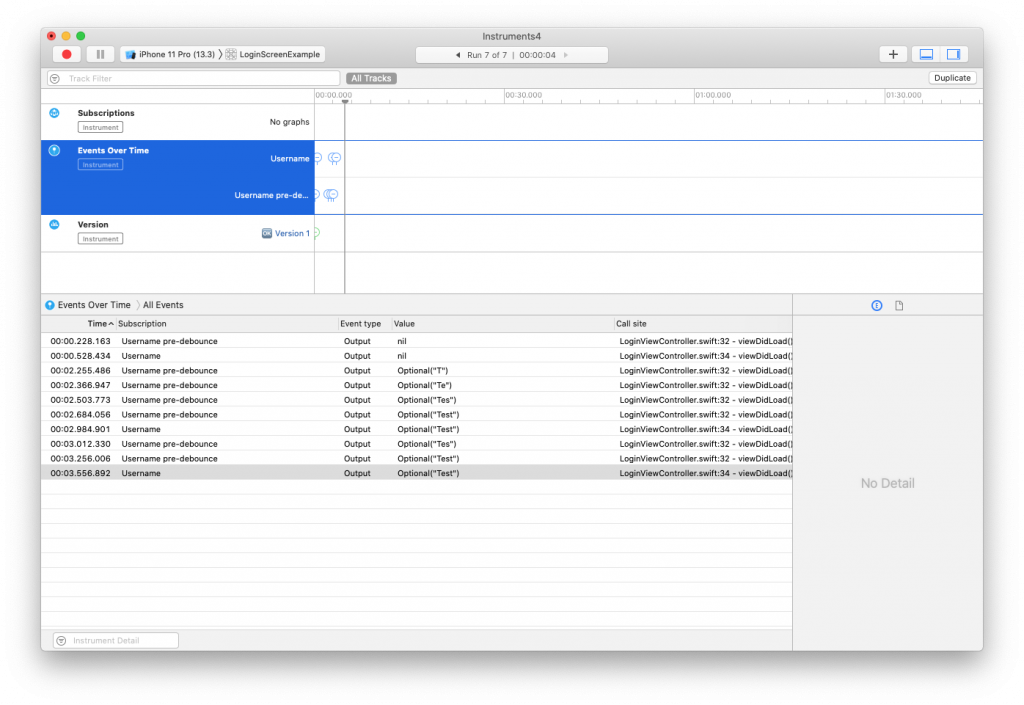
By clicking the events lane, the bottom panel in Instruments shows an overview of all events that were logged per lane. Note that the string Test got delivered to the sink twice. The reason is that I hit backspace after typing but immediately typed another t. This means that we're processing the same output twice which could be wasteful. By applying the removeDuplicates operator after debounce, we can fix this:
usernameField.$value
  .lane("Username pre-debounce", filter: [.event])
  .debounce(for: 0.3, scheduler: DispatchQueue.main)
  .removeDuplicates()
  .lane("Username", filter: [.event])
  .sink(receiveValue: { value in
    // handle value
  })
  .store(in: &cancellables)
And if you look at the events view in Instruments again, you can see that the duplicate value is now gone:
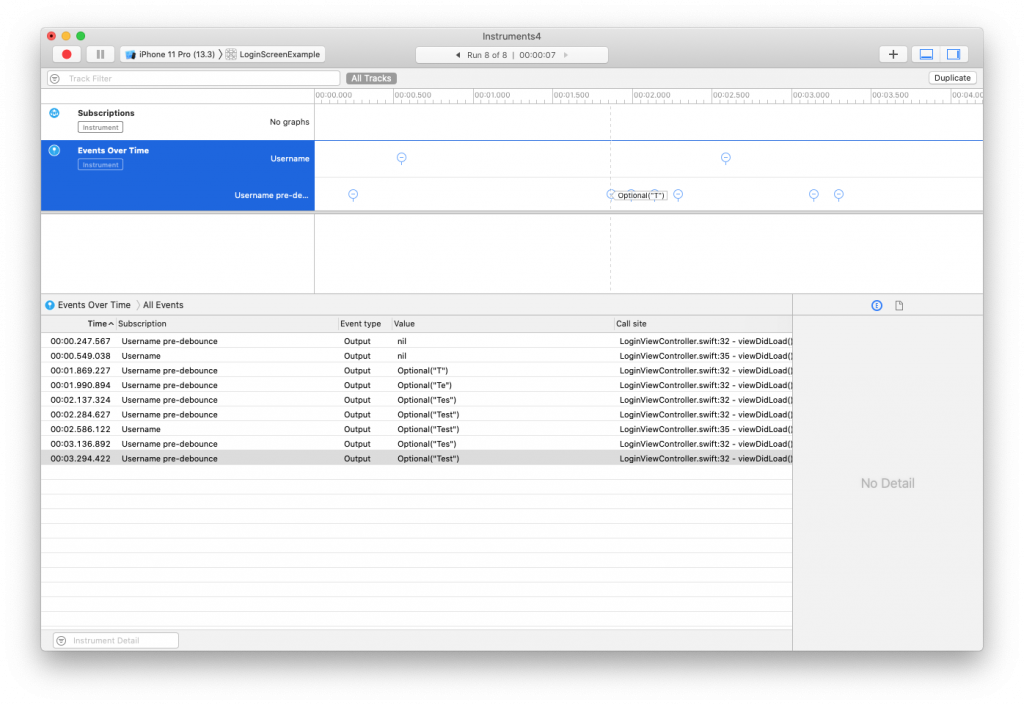
The ability to examine individual values through Instruments and Timelane is extremely useful to identify and fix problems or potential issues that you might not have discovered otherwise.
Note that the output in Instruments looks like this Optional("Test"). The output would look much nicer if we printed Test instead. You can achieve this by passing a transformValue closure to the lane operator. This closure is passed the value that Timelane will log to Instruments and you can modify this value by returning a new value from the closure:
usernameField.$value
  .lane("Username pre-debounce", filter: [.event])
  .debounce(for: 0.3, scheduler: DispatchQueue.main)
  .removeDuplicates()
  .lane("Username", filter: [.event], transformValue: { value in
    return value ?? ""
  })
  .sink(receiveValue: { value in
    // handle value
  })
  .store(in: &cancellables)
By returning value ?? "" the logged value is no longer an optional, and Timelane will log Test instead of Optional("Test"). You can also apply more elaborate transformations to the logged value. For example, you could write the following code to print Value is: Test instead of just the received value:
usernameField.$value
  .lane("Username pre-debounce", filter: [.event])
  .debounce(for: 0.3, scheduler: DispatchQueue.main)
  .removeDuplicates()
  .lane("Username", filter: [.event], transformValue: { value in
    return "Value is: \(value ?? "")"
  })
  .sink(receiveValue: { value in
    // handle value
  })
  .store(in: &cancellables)
The ability to transform the logged value can be very helpful if you want a little bit more control over what is logged exactly or if you want to make Timelane's logged values more readable which is especially useful if you're logging more complex objects than a String. For example, you might not want to log an entire User struct but instead only return its id or name property in the transformValue closure. It's entirely up to you to decide what you want to log.
In Summary
Being able to see what's going on inside of your application's asynchronous code is an invaluable debugging tool so the fact that Marin created and open-sourced Timelane is something that I am extremely grateful for. It makes debugging and understanding Combine code so much easier, and the fact that you get all of this information through a simple operator is somewhat mind-boggling.
The tool is still very young but in my opinion, Timelane is well on its way to become a standard debugging tool for RxSwift and Combine code. If you like Timelane as much as I do, be sure to share the love and let Marin know. And if you have any questions or feedback about this post, don't hesitate to reach out on Twitter.


