Using Instruments to profile a SwiftUI app
Published on: April 16, 2025Updated on: April 30, 2025
A key skill for every app developer is being able to profile your app's performance. Your app might look great on the surface, but if it doesn’t perform well, it’s going to feel off—sometimes subtly, sometimes very noticeably. Beautiful animations, slick interactions, and large data sets all fall flat if the app feels sluggish or unresponsive.
Great apps respond instantly. They show that you’ve tapped something right away, and they make interactions feel smooth and satisfying.
To make sure your app behaves like that, you’ll need to keep an eye on its performance. In this post, we’ll look at how you can use Instruments to profile your SwiftUI app. We’ll cover how to detect slow code, track view redraws, and understand when and why your UI updates. If you're interested in a deeper dive into SwiftUI redraws or profiling slow code, check out these posts:
We’ll start by building your app for profiling, then look at how to use Instruments effectively—both for SwiftUI specifics and general performance tracking.
Building an app for profiling
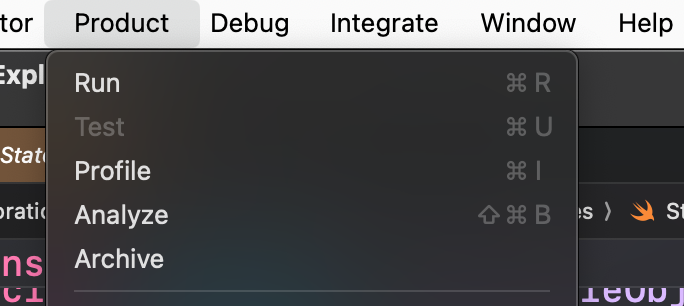
The first step is to build your app using Product > Profile, or by pressing Cmd + I (sidenote: I highly recommend learning shortcuts for command you use frequently).
This builds your app in Release mode, using the same optimizations and configurations as your production build.
This is important because your development build (Debug mode) isn’t optimized. You might see performance issues in Debug that don’t exist in Release. I recently had this happen while working with large data sets—code ran pretty horrible in Debug was optimized in Release to the point of no longer being a problem at all.
When this happens, it usually means there’s some inefficiency under the hood, but I wouldn’t spend too much time on issues that disappear in Release mode when you have bigger issues to work on.
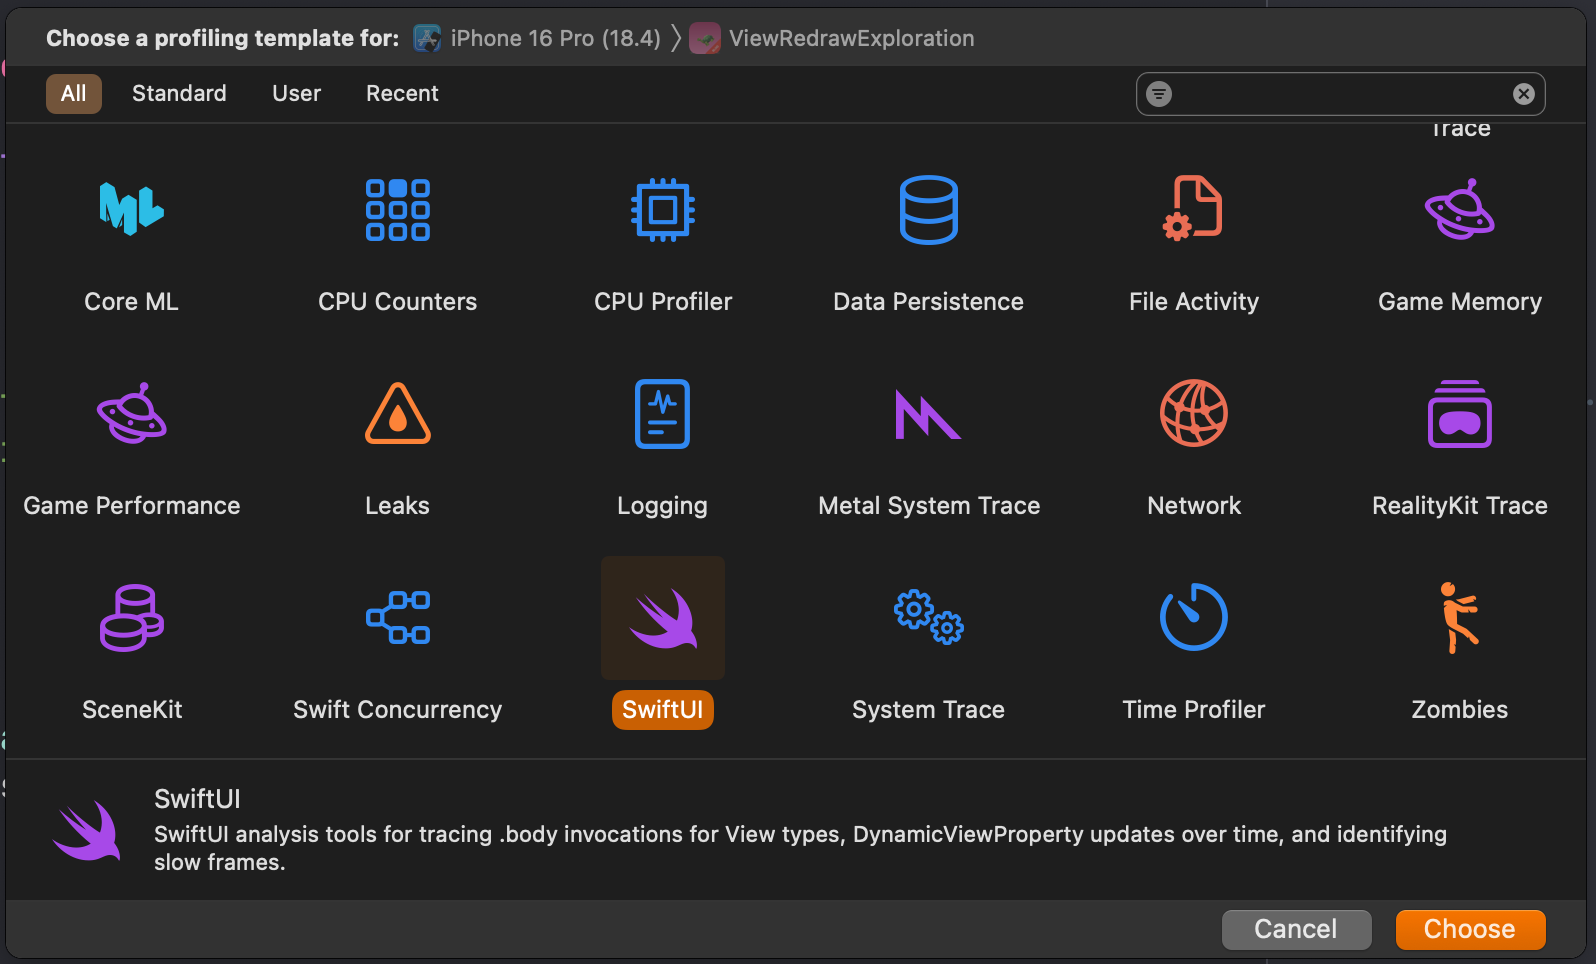
Once your app is built and Instruments launches, you’ll see a bunch of templates. For SwiftUI apps, the SwiftUI template is usually the right choice—even if you’re not profiling SwiftUI-specific issues. It includes everything you need for a typical SwiftUI app.
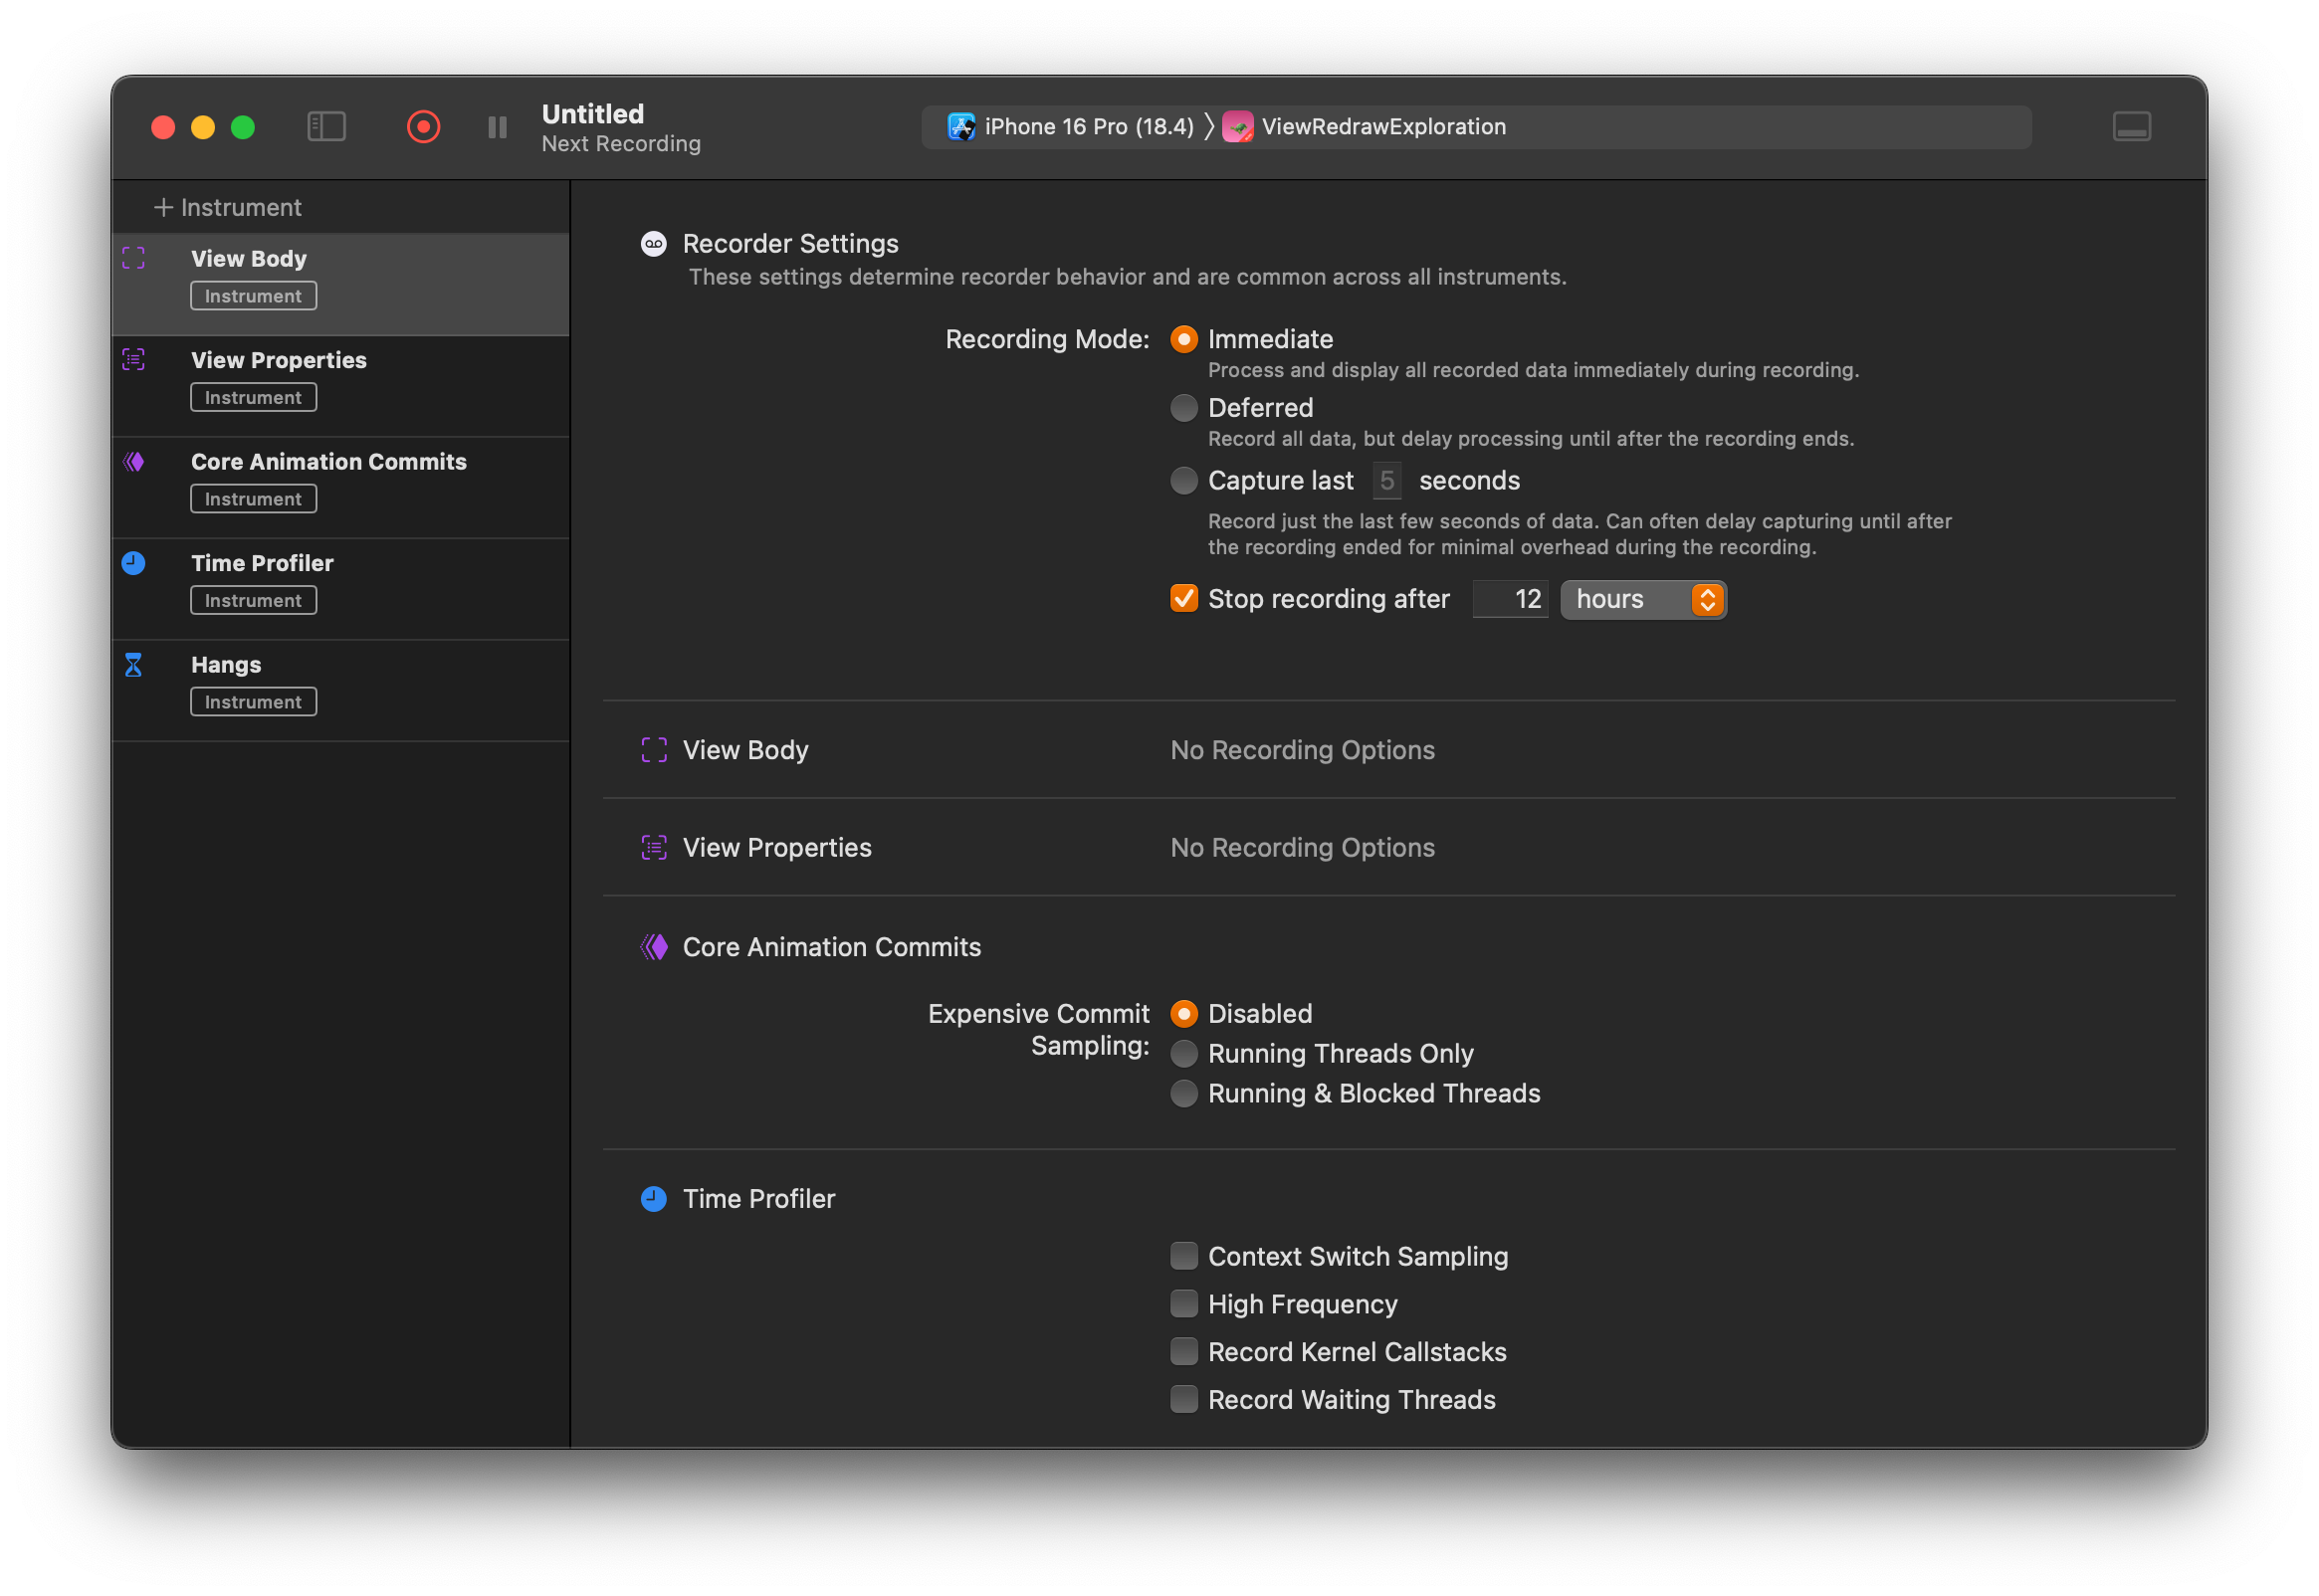
After picking your template, Instruments opens its main window. Hit the red record button to start profiling. Your app will launch, and Instruments will start collecting data in real-time based on the instruments you selected. The SwiftUI template collects everything in real-time.
Reading the collected data
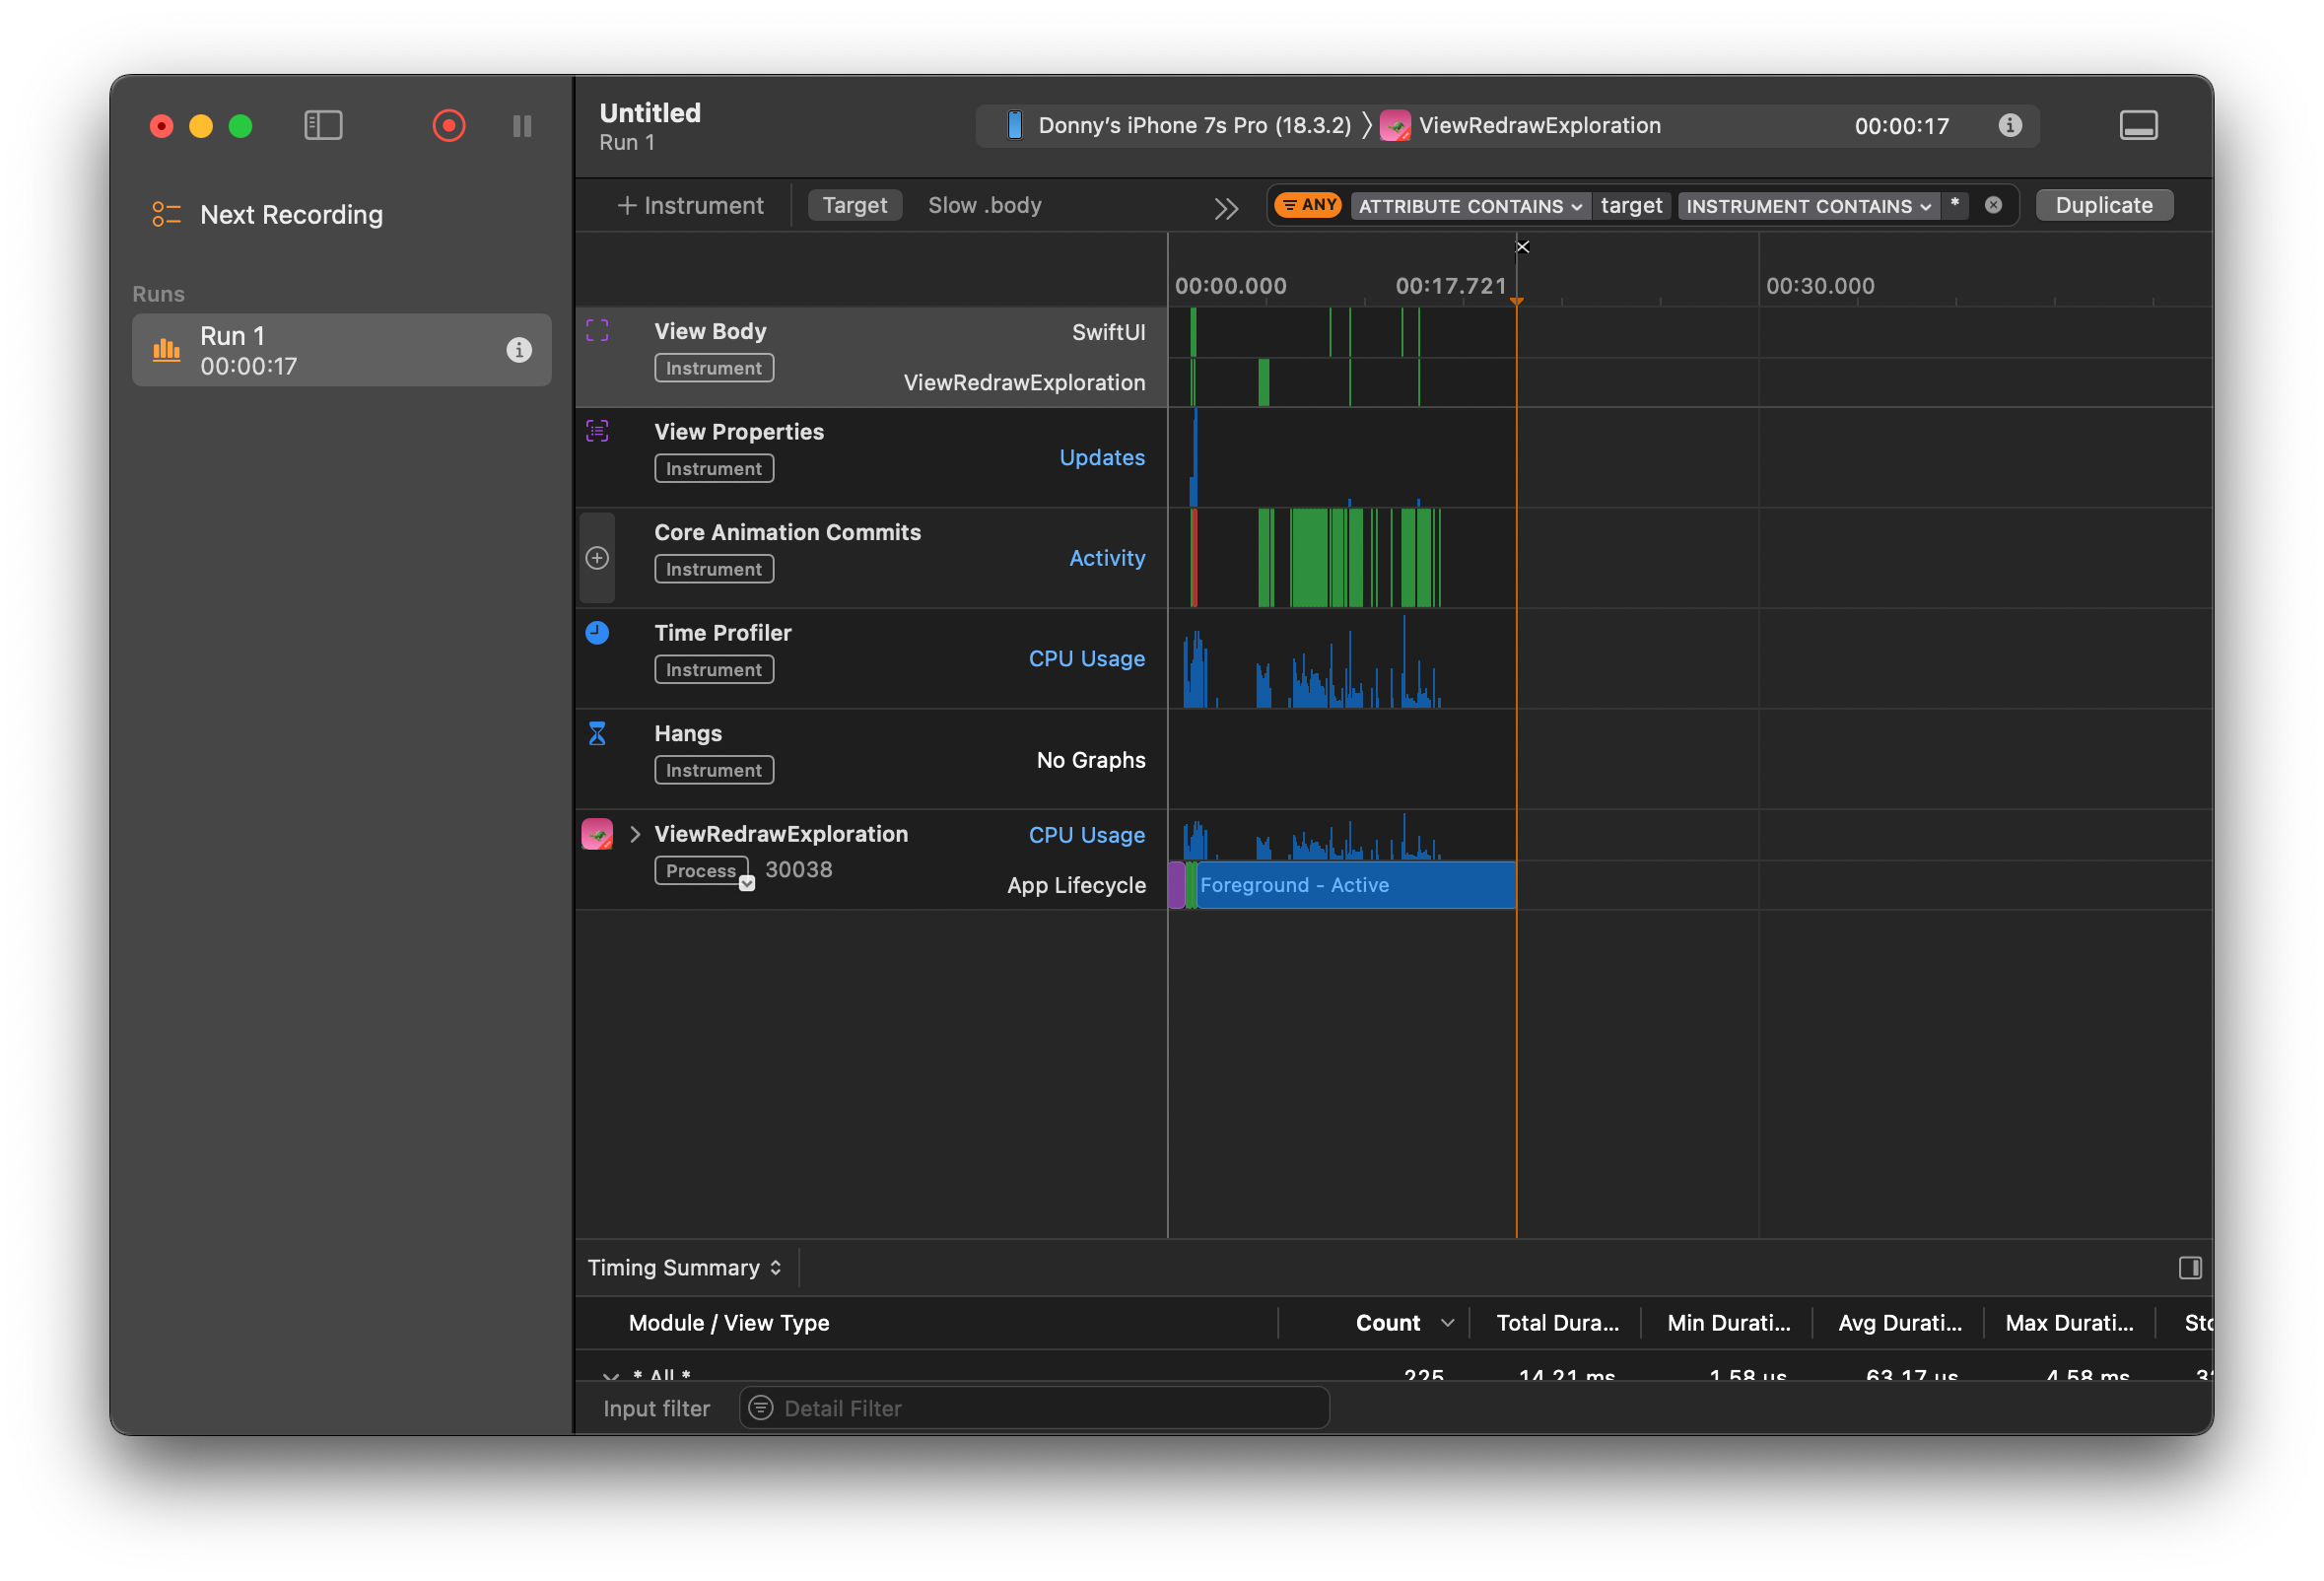
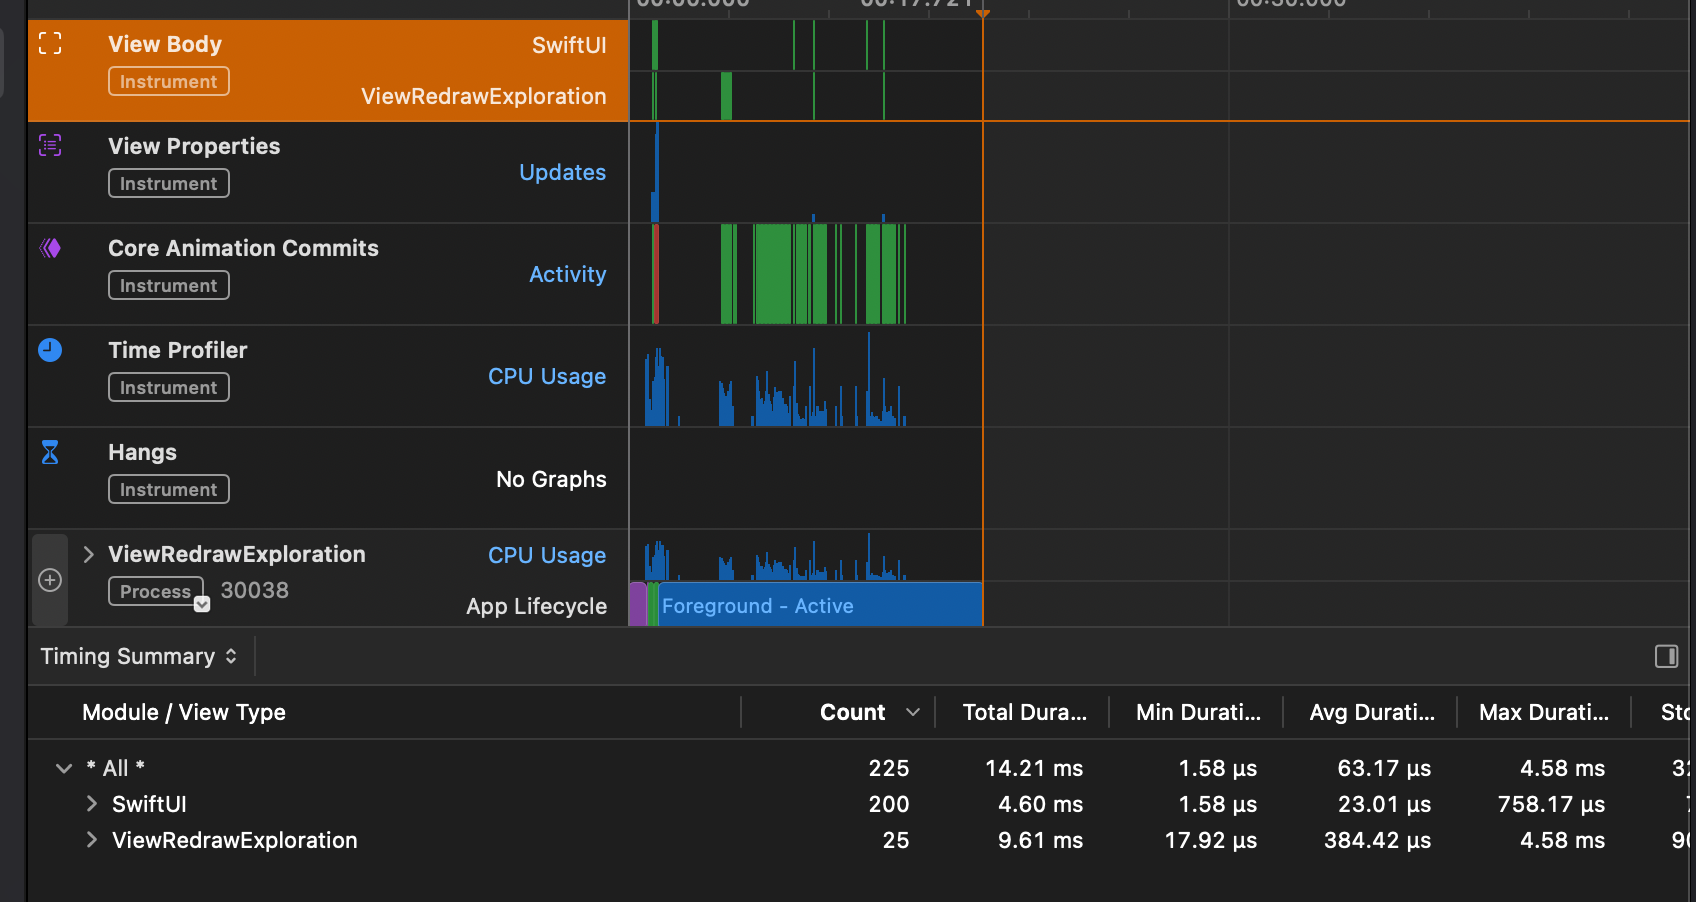
Instruments organizes its data into several lanes. You’ll see lanes like View Body, View Properties, and Core Animation Commits. Let’s go through them from top to bottom.
Note that I’m testing on a physical device. Testing on the simulator can work okay for some use cases but results can vary wildly between simulators and devices due to the resources available to each. It’s always recommended to use a device when testing for performance.
The View Body lane
This lane shows how often a SwiftUI view’s body is evaluated. Whenever SwiftUI detects a change in your app’s data, it re-evaluates the body of any views that depend on that data. It then determines whether any child views need to be redrawn.
So, this lane essentially shows you which views are being redrawn and how often. If you click the timing summary, you’ll see how long these evaluations take—total, min, max, and average durations. This helps you identify whether a view’s body is quick or expensive to evaluate.
By default, Instruments shows data for the entire profiling session. That means a view that was evaluated multiple times may have been triggered by different interactions over time.
Usually, you’ll want to profile a specific interaction. You can do this by dragging across a timeframe in the lane. This lets you zoom in on a specific window of activity—like what happens when you tap a button.
Once you’ve zoomed in, you can start to form a mental model.
For example, if tapping a button increases a counter, you’d expect the counter view’s body to be evaluated. If other views like the button’s parent also redraw, that might be unexpected. Ask yourself: did I expect this body to be re-evaluated? If not, it’s time to look into your code.
In my post on SwiftUI view redraws, I explain more about what can cause SwiftUI to re-evaluate views. It’s worth a read if you want to dig deeper.
View Properties and Core Animation Commits
The View Properties and Core Animation Commits lanes are ones I don’t use very often.
In View Properties, you can see which pieces of state SwiftUI tracked for your views and what their values were. In theory, you can figure out how your data model changed between body evaluations—but in practice, it’s not always easy to read.
Core Animation Commits shows how much work Core Animation or the GPU had to do when redrawing views. Usually, it’s not too heavy, but if your view body takes a long time to evaluate, the commit tends to be heavier too.
I don’t look at this lane in isolation, but it helps to get a sense of how expensive redrawing became after a body evaluation.
Reading the Time Profiler
The Time Profiler might be the most useful lane in the SwiftUI Instruments template. It shows you which code was running on which thread, and how long it was running.
You’re essentially seeing snapshots of the CPU at short intervals. This gives you insight into how long specific functions were active.
When profiling SwiftUI apps, you’ll usually be interested in code related to your data model or views. If a function updates your data and appears slow, or if it’s called from a view body, that might explain a performance issue.
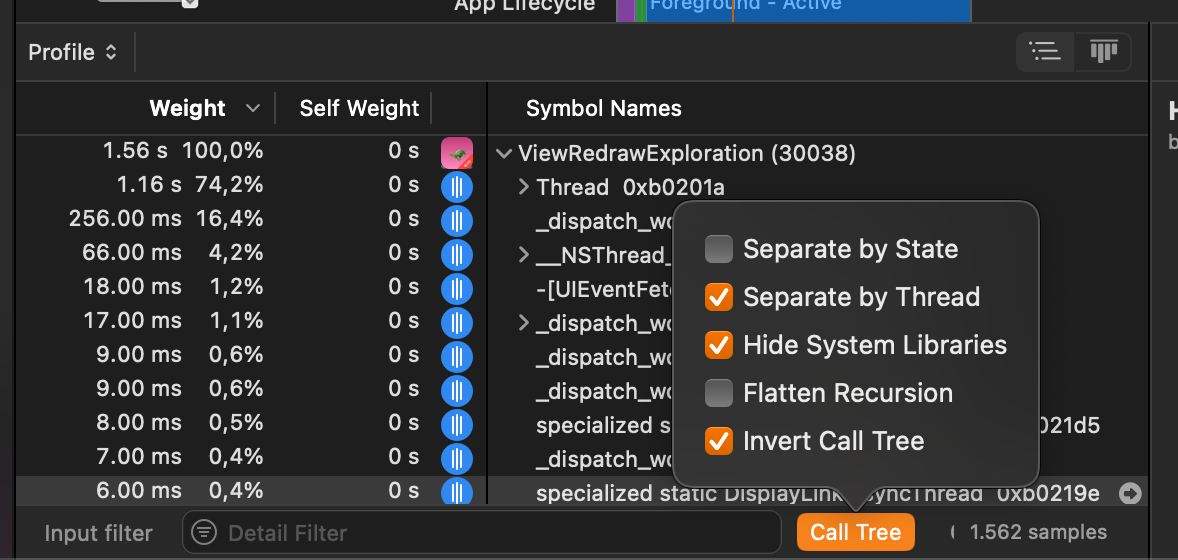
Getting comfortable with the time profiler takes a bit of practice. I recommend playing around with the call tree settings. I usually:
- Separate by thread
- Invert the call tree
- Hide system libraries
Sometimes, I tweak these settings depending on what I’m trying to find. It’s worth exploring.
In summary
Profiling your code and understanding how to use Instruments is essential if you want to build responsive, high-quality apps. As your app grows, it gets harder to mentally track what should happen during an interaction.
The tricky part about using Instruments is that even with a ton of data, you need to understand what your app is supposed to be doing. Without that, it’s hard to tell which parts of the data matter. Something might be slow—but that might be okay if it’s processing a lot of data.
Still, getting into the habit of profiling your app regularly helps you build a sense of what’s normal and what’s not. The earlier and more often you do this, the better your understanding becomes.