Using Xcode’s memory graph to find memory leaks
Published on: December 9, 2019There are many reasons for code to function suboptimally. In a post, I have shown you how to use the Time Profiler to measure the time spent in each method in your code, and how to analyze the results. While a lot of performance-related problems can be discovered, analyzed and fixed using these tools, memory usage must often be debugged slightly differently. Especially if it's related to memory leaks.
In today's post, I will show you how to use the Memory Graph tool in Xcode to analyze the objects that are kept in memory for your app, and how to use this tool to discover memory leaks. I will focus specifically on retain cycles today.
Activating the Memory Graph
When you run your app with Xcode, you can click the memory debugger icon that's located between your code and the console, or at the bottom of your Xcode window if you don't have the console open:
![]()
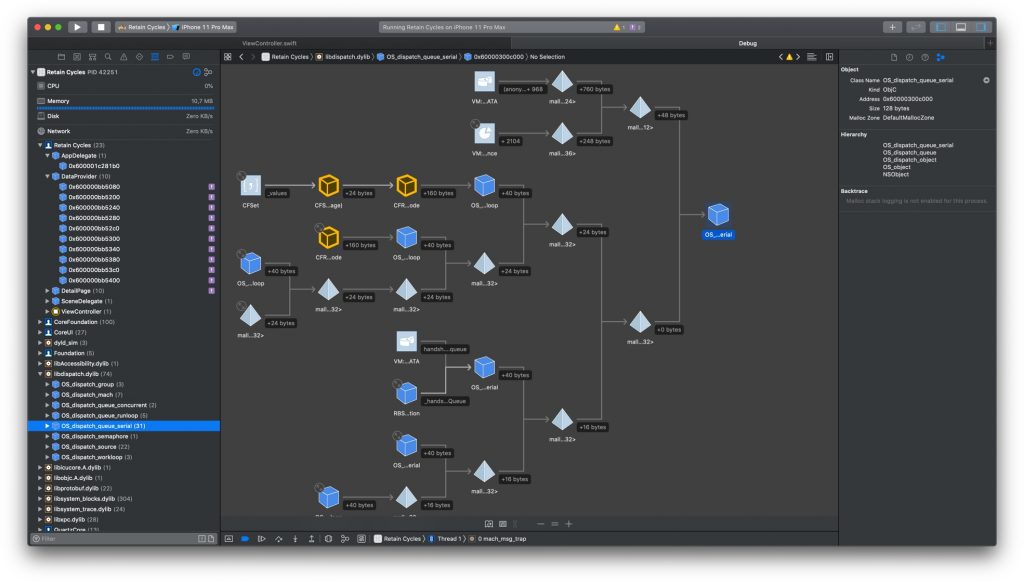
When you click this icon, Xcode will take a snapshot of your app's memory graph and the relationships that every object has to other objects. Your app's execution will be paused and Xcode will show you all objects that are currently in memory. Note that this might take a little while, depending on how big your app is.

In the sidebar on the left-hand side, Xcode shows a full list of all objects that it has discovered. When you select an object in the sidebar, the middle section will show your selected object, and the relationships it has to other objects. Sometimes it's a big graph, like in the screenshot. Other times it's a smaller graph with just a couple of objects.
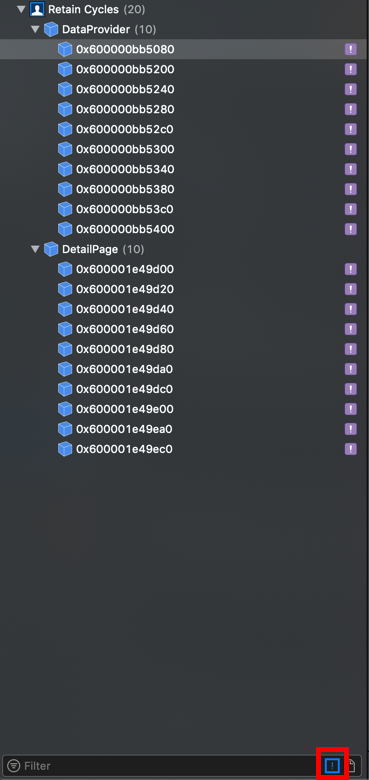
If Xcode spots a relationship that it suspects to be a memory leak, or retain cycle, it will add a purple square with a exclamation mark behind the object in the sidebar. In the screenshot you just saw, it's quite obvious where the purple squares are. If they are more hidden, or you just want to filter memory leaks, you can do so using the filter menu at the bottom of the sidebar as shown in the following screenshot:

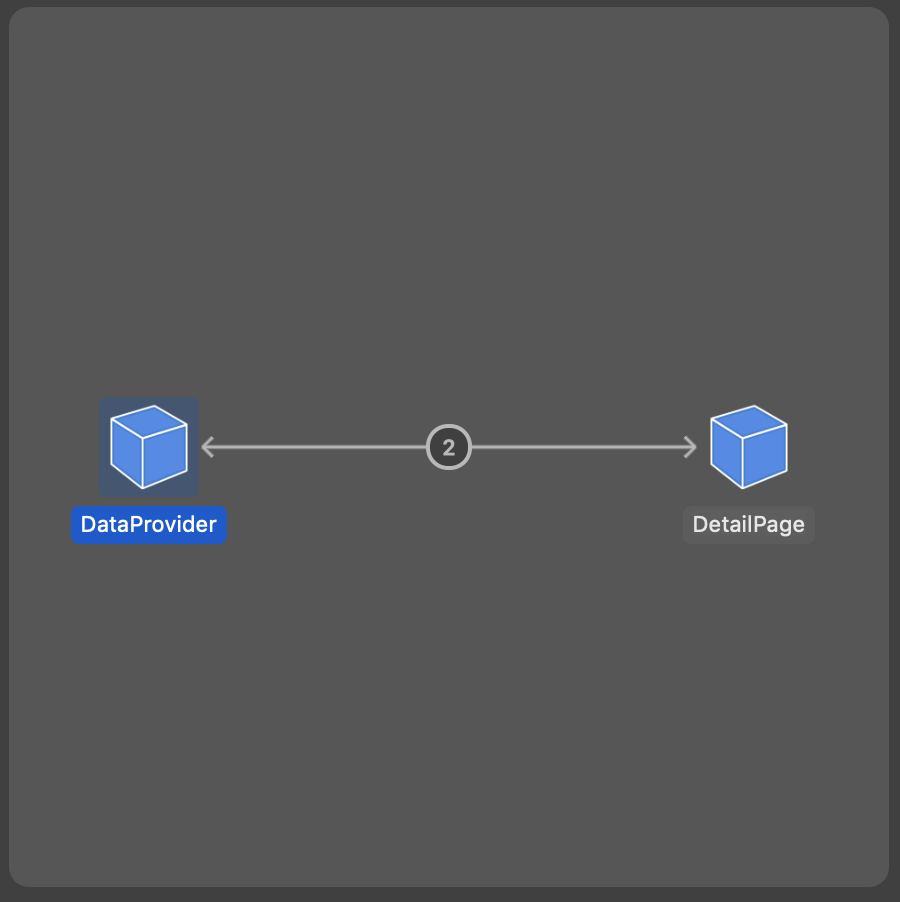
The screenshot above shows that instances of two different objects are kept in memory while Xcode thinks they shouldn't. When you click one of them, the problem becomes visible immediately.

The DataProvider and DetailPage in this example are pointing at each other. A classic example of a retain cycle. Let's see how this occurs and what you can do to fix it.
Understanding how retain cycles occur and how to fix them
In iOS, objects are removed from memory when there are no other objects that keep a strong reference to them. Every instance of an object you create in your app has a retain count. Any time you pass a reference to your object to a different place in your code, its retain count is increased because there is now one more object pointing at the location in memory for that object.
This principle of retain counts mostly applies to classes. Because when you pass around an instance of a class in your code, you're really passing around a memory reference, which means that multiple objects point to the same memory address. When you're passing around value types, the value is copied when it's passed around. This means that the retain count for a value type is typically always one; there is never more than one object pointing to the memory address of a value type.
In order for an object to be removed from memory, its reference count must be zero; no objects should be referencing that address in memory. When two objects hold a reference to each other, which is often the case when you're working with delegates, it's possible that the reference count for either object never reached zero because they keep a reference to each other. Note that I mentioned a strong reference at the beginning of this section. I did that on purpose, if we have a strong reference, surely there is such a thing as a weak reference right? There is!
Weak references are references to instances of reference types that don't increase the reference count for the object the reference points to. The principles that apply here are exactly the same as using weak self in closures. By making the delegate property of an object weak, the delegate and its owner don't keep each other alive and both objects can be deallocated. In the example we were looking at this means that we need to change the following code:
class DataProvider {
  var delegate: DataDelegate?

  // rest of the code
}
Into the following:
class DataProvider {
  weak var delegate: DataDelegate?

  // rest of the code
}
For this to work, DataDelegate must be constrained to being a class, you can do this by adding : AnyObject to your protocol declaration. For example:
protocol DataDelegate: AnyObject {
  // requirements
}
When you'd run the app again and use the memory graph to look for retain cycles, you would notice that there are no more purple squares and the memory graph looks exactly like you'd expect.
In Summary
In this article, I have shown you that you can use Xcode to visualize and explore the memory graph of your app. This helps you to find memory leaks and retain cycles. When clicking on an object that's in memory, you can explore its relationship with other objects, and ultimately you can track down retain cycles. You also learned what a retain cycle is, how they occur and how you can break them.
If you have questions, feedback or anything else for me, don't hesitate to reach out on Twitter

)
